
Figure 4. AZD1775 sensitizes HNSCC cells to TNFα-induced cell death.
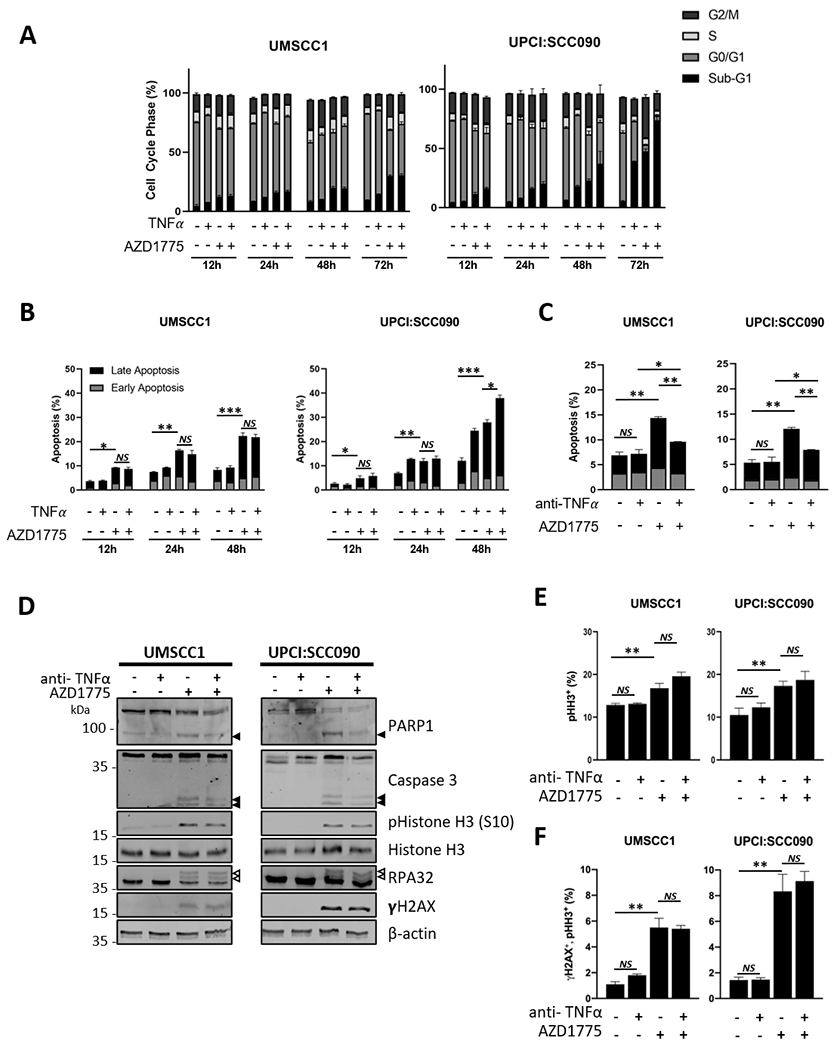
(A) HPV− UMSCC1 and HPV+ UPCI:SCC090 cells were treated with AZD1775 (500 nM for UMSCC1, 250 nM UPCI:SCC-090) and/or TNFα (10 ng/mL) for 12, 24 48 or 72 hours. Flow cytometric analysis of the cell cycle was performed using a FACS Canto flow cytometer. Data from 10,000 cells per sample analyzed using Flow-Jo analysis software. (B) UMSCC1 and UPCI:SCC090 cells were treated with AZD1775 as above for 12, 24 and 48 hours. Flow cytometric analysis of apoptosis was performed using Annexin V assay. Data from 10,000 cells per sample analyzed using Flow-Jo analysis software. Early apoptotic cells were defined as Annexin positive/PI negative and late apoptotic cells was defined as Annexin positive/PI positive. (C) UMSCC1 and UPCI:SCC090 cells were treated with AZD1775 for 20 hours after pre-treatment with a neutralizing TNFα or IgG control for 4 hours. Flow cytometric analysis of the cell cycle was performed using a FACS Canto flow cytometer. Data from 10,000 cells per sample analyzed using Flow-Jo analysis software. (D) UMSCC1 and UPCI:SCC090 cells were treated with AZD1775 for 20 hours after pre-treatment with a neutralizing TNFα or IgG control for 4 hours. Whole cell lysates were analyzed for PARP1 cleavage and Caspase 3 cleavage, phosphorylated and total Histone H3, RPA32 and γH2AX expression. β-actin was used as a loading control. (E) UMSCC1 and UPCI:SCC090 cells were treated with AZD1775 for 20 hours after pre-treatment with a neutralizing TNFα or IgG control for 4 hours. The expression of phosphorylated Histone H3 (S10) was analyzed by flow cytometry using a FACS Canto flow cytometer. The percent of positive cells is shown as a marker for mitosis. Data from 10,000 cells per sample analyzed using Flow-Jo analysis software. (F) UMSCC1 and UPCI:SCC090 cells were treated with AZD1775 for 20 hours after pre-treatment with a neutralizing TNFα or IgG control for 4 hours. The expression of phosphorylated Histone H3 (S10) and γH2AX was analyzed by flow cytometry using a FACS Canto flow cytometer. The percent of double positive cells is shown as a marker for DNA damage in mitosis. Data from 10,000 cells per sample analyzed using Flow-Jo analysis software. *P<0.05, **P<0.01 and ***P<0.001 (Student’s T Test). Error bars represent the mean ± standard deviation of a minimum of three biological repeats. *P<0.05, **P<0.01 and ***P<0.001 (Student’s T Test).