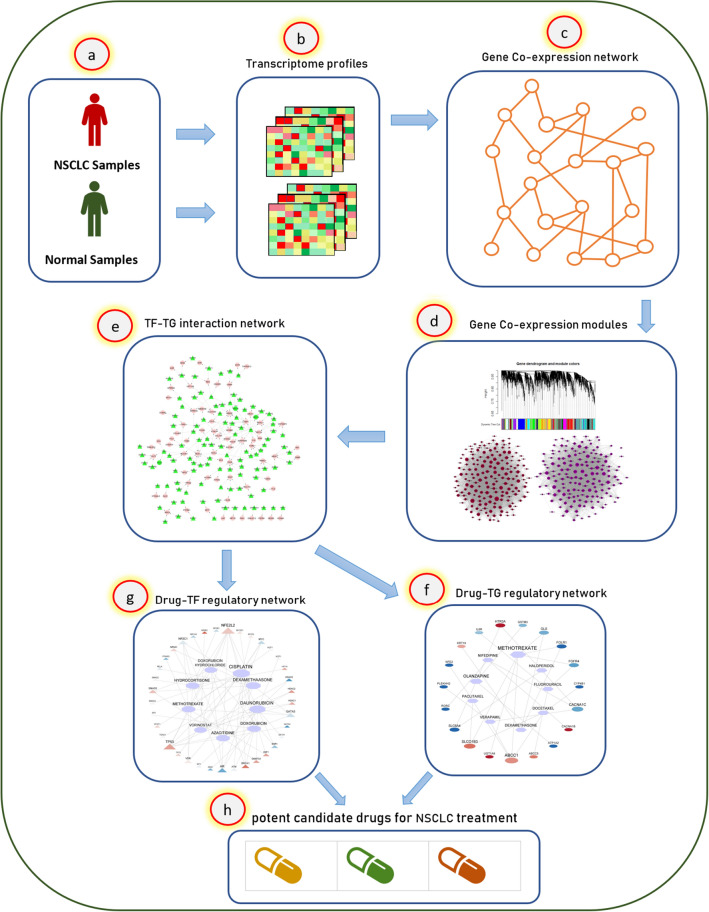
Figure 1.
The workflow diagram of the proposed method. This study applies a gene co-expression network and a drug–gene regulatory network analysis to reposition candidate drugs for NSCLC treatment. (a,b) At first, a transcriptome profile for normal and NSCLC samples was downloaded from the GEO database with the accession number GSE21933. (c,d) Then, a gene co-expression network was reconstructed for the differentially expressed genes (p_value < 0.01) of normal and NSCLC groups using the WGCNA package in the R programming environment, and two significant gene modules (purple and magenta) were extracted from the NSCLC co-expression network. (e) Next, a list of transcription factor genes, which regulate purple and magenta modules' genes, were obtained from the Trrust V2.0 40 online database. (f,g) Subsequently, two drug–gene interaction networks, named drug-TG (target gene) and drug-TF (transcription factor gene), were drawn using the DGIdb V4.042 online database. (e) Finally, 18 candidate drugs are proposed for NSCLC treatment.

