
Figure 3.
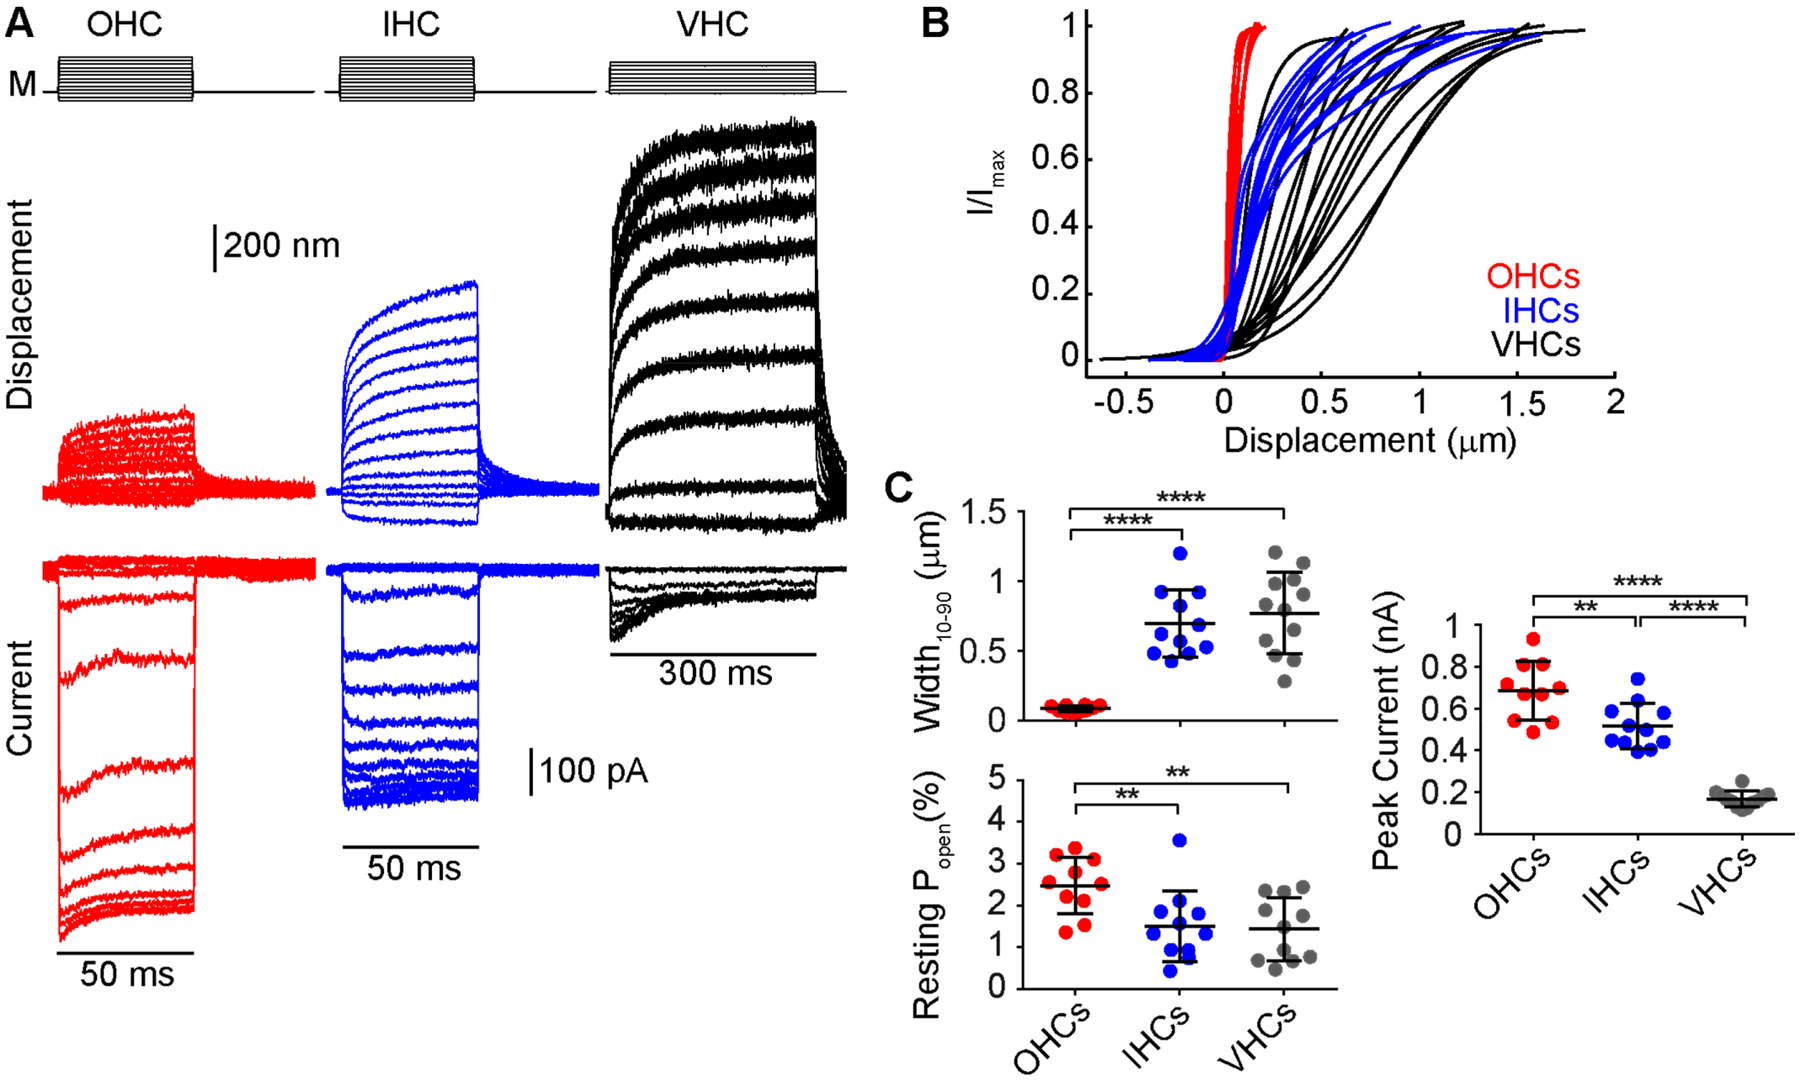
Activation curves in IHCs and vestibular hair cells are significantly wider than those of OHCs. (A) Example of a family of curves (bottom) in mouse cochlear hair cells (OHC-red and IHC-blue) and a mouse utricular type II hair cell (black) taken using a fluid-jet stimulus (M) and extracting the displacement of the hair bundle (middle) using high-speed imaging to generate the activation curves (Caprara et al., 2020). (B) Activation curves for multiple different cells in the same recording configuration across different cell types. Cells were recorded using an intracellular solution containing 0.1 mM BAPTA. n = 10 OHCs, P7-P9; n = 11 IHCs, P7-P8; n = 12 vestibular type II hair cells, P8-P11. (C) Summary plots of the width, resting open probability and maximum mechanotransduction current amplitude indicate a significantly lower peak current, wider activation curve, and lower resting probability in IHCs and vestibular hair cells. **** p < 0.0001 ** p < 0.01 Student’s t-test.