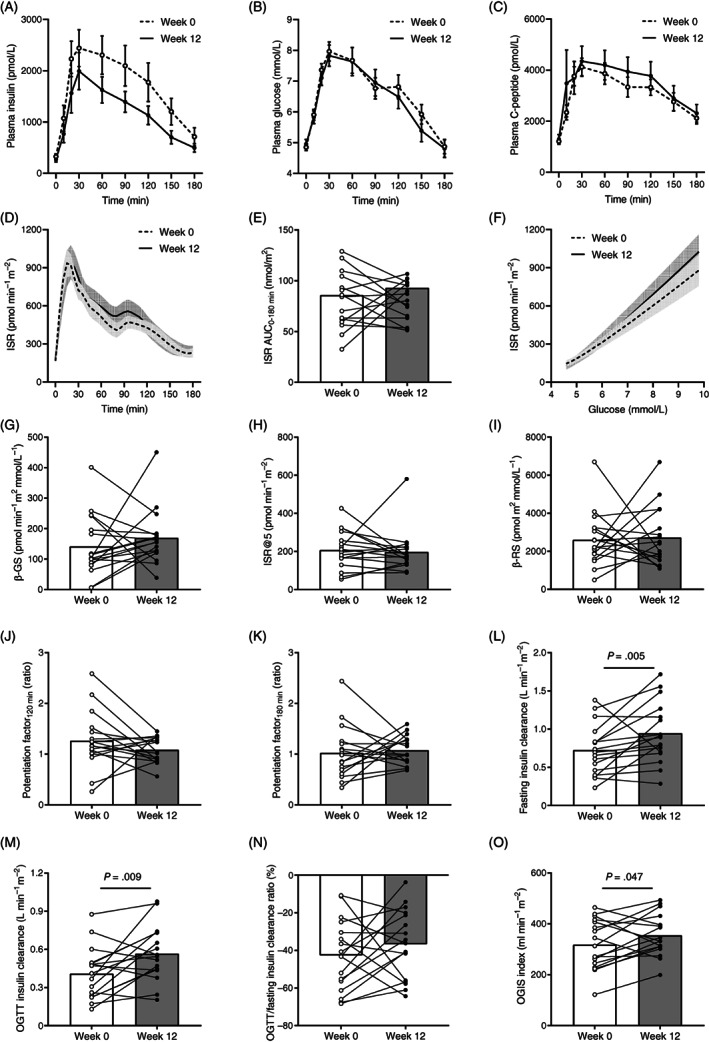
FIGURE 1.

A, Plasma insulin, B, Glucose, and C, C‐peptide concentrations; D, Insulin secretion rate (ISR); E, Area under the 180‐minute curve (AUC0−180 min) of ISR; F, ISR relative to plasma glucose; G, β‐cell glucose sensitivity (β‐GS); H, ISR at a fixed fasting plasma glucose of 5 mmol/L (ISR@5); I, β‐cell rate sensitivity (β‐RS); potentiation factor ratio at J, 120 minutes, and K, 180 minutes; insulin clearance at L, Fasting, M, During the oral glucose tolerance test (OGTT), and N, Percentage reduction from fasting to OGTT; and O, Oral glucose insulin sensitivity (OGIS) index at baseline (week 0) and after the low n‐6:n‐3 polyunsaturated fatty acid ratio diet (week 12) in obese youth. Lines and columns indicate means. Error bars and shaded areas indicate SEM. Panels A and B are modified with permission from. 23 Group differences were tested using paired Wilcoxon signed‐rank test. P values less than .10 are reported
