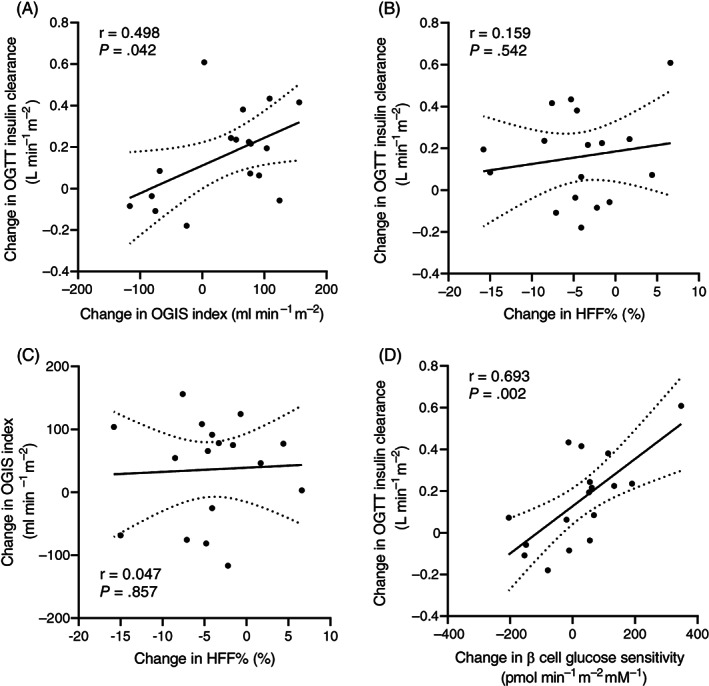
FIGURE 2.

A, Correlation between changes in oral glucose insulin sensitivity (OGIS) index and changes in insulin clearance during the oral glucose tolerance test (OGTT); correlation between changes in hepatic fat fraction (HFF%), and B, Changes in insulin clearance during the OGTT, or C, Changes in OGIS index; and D, Correlation between changes in β‐cell glucose sensitivity and changes in insulin clearance during the OGTT. Changes were calculated as the difference between values measured after and before the 12‐week low n‐6:n‐3 polyunsaturated fatty acid ratio diet. Correlations were tested using Pearson's correlation. Areas between dotted lines indicate 95% confidence intervals of the best‐fit line
