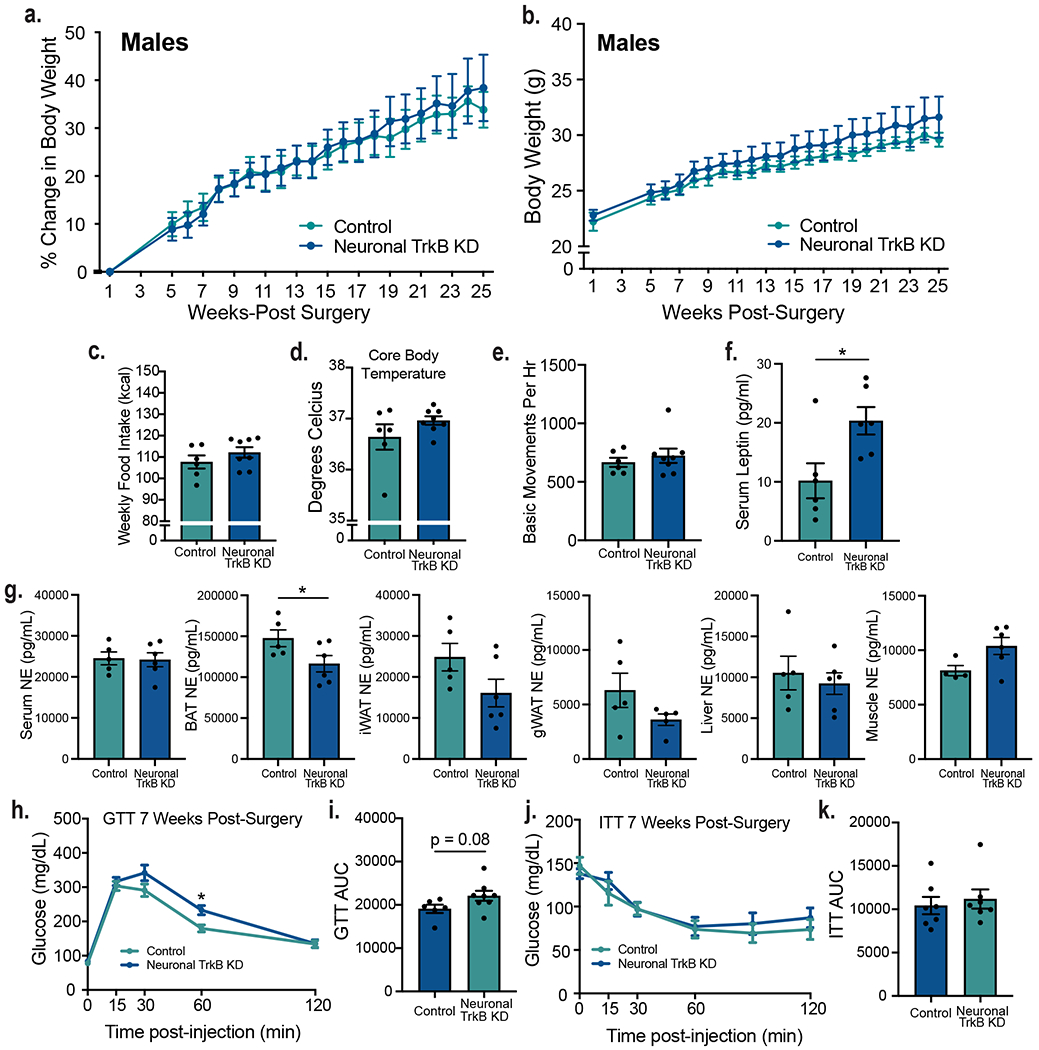
Extended Data Fig. 7. TrkB in VMH neurons is not required for the regulation of energy balance under chow conditions but is essential for glycemic control.

A . Percent body weight gain in Neuronal TrkB KD and control mice (n = 6). Two-way RM ANOVA: Genotype, p = 0.88; Time, p <0.0001; Interaction, p = 0.85; Subjects (matching), p <0.0001.
B. Body weights of Neuronal TrkB KD and control mice (n = 7). Two-way RM ANOVA: Genotype, p = 0.44; Time, p <0.0001; Interaction, p 0.76; Subjects (matching), p <0.0001.
C. Average weekly food intake weeks 3 - 6 post-surgery in neuronal TrkB KD (n = 8) and control (n = 6) mice. Student’s two-sided t-test, NS.
D. Core body temperatures in neuronal TrkB KD (n = 8) and control (n = 6) mice. Student’s two-sided t-test, NS.
E. Basic movements per hour of neuronal TrkB KD (n = 8) and control (n = 6) mice recorded over 6 days.
F. Serum levels of leptin (pg/mL) in fed animals (n = 6). Students two-sided t-test, *, p = 0.02.
G. Norepinephrine levels in indicated tissues in neuronal TrkB KD (n = 6) and control (n = 5) mice. Student’s two-sided t-test, *, p = 0.05.
H. Glucose tolerance test of neuronal TrkB KD (n = 8) and control (n = 6) mice. Two-way RM ANOVA; Time, p < 0.0001; Genotype, p = 0.1; Interaction, p = 0.01. Bonferroni multiple comparisons, *, p = 0.04.
I. GTT area under the curve. Students two-sided t-test, p = 0.08.
J. Insulin tolerance test (n = 7). Two-way RM ANOVA; Time, p < 0.0001; Genotype, p = 0.65; Interaction, p = 0.48. Bonferroni multiple comparisons.
K. ITT area under the curve. Students t-test, NS. Data represented as mean +/− SEM.
