
Figure 4: Depletion of TrkB.T1 from VMH astrocytes of adult mice leads to impaired glycemic control and leptin resistance.
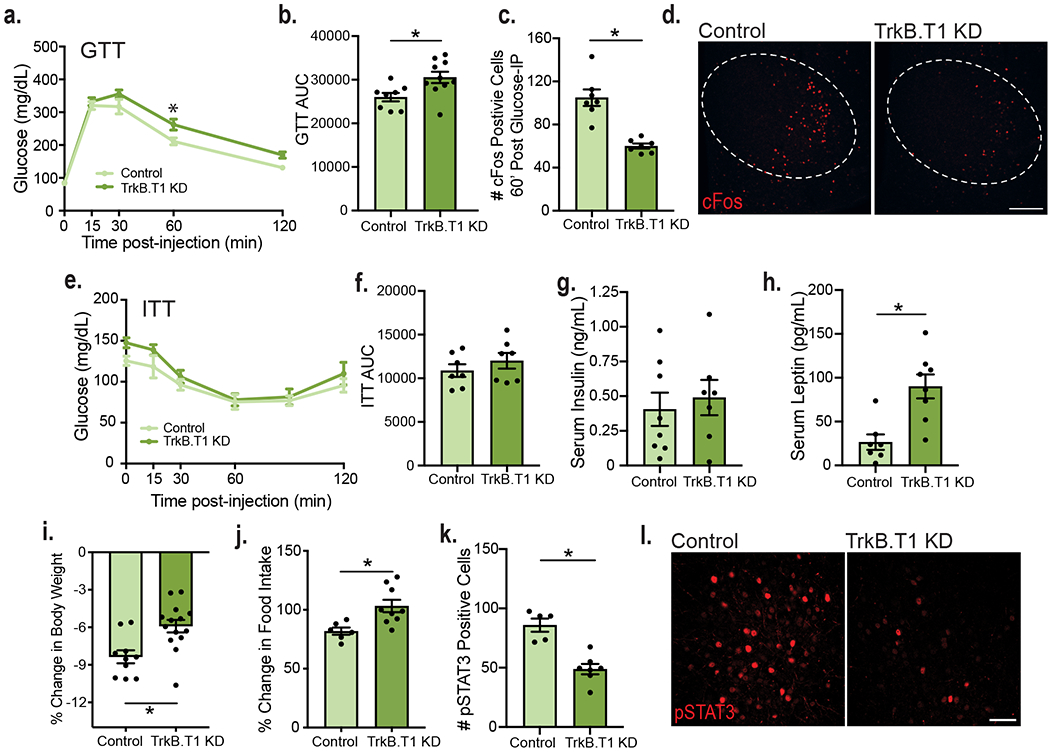
a, Glucose tolerance test (GTT) in TrkB.T1 KD (n = 10) and control males (n = 8). Two-way RM ANOVA; Time, p < 0.0001; Genotype, p = 0.0296; Time x Genotype Interaction, p = 0.0796; Subject, p = 0.0002. Bonferroni multiple comparisons, *, p = 0.01. b, Area under the curve for the GTT (Control, n = 8 and TrkB.T1 KD, n = 10). Students unpaired two-sided t-test, *, p = 0.01. c, Quantification of c-fos+ cells within the VMH of fasted (16 hours) TrkB.T1 KD mutant and control animals 60 min. following glucose administration (n = 7). Student’s unpaired two-sided t-test, *, p = 0.0001. d, Representative images of VMH c-fos expression 60 min. following glucose administration in fasted mice. Scale bar is 250 uM. e, Insulin tolerance test (ITT) in TrkB.T1 KD and control males (n = 7). Two-way RM ANOVA; Time, p < 0.0001; Genotype, p = 0.192; Time x Genotype Interaction, p = 0.626; Subject, p = 0.0001. Bonferroni multiple comparisons, NS. f, Area under the curve for the ITT (n = 7). Student’s unpaired two-sided t-test, NS g, Serum levels of insulin of fasted TrkB.T1 KD (n = 7) and control males (n = 8). h, Serum levels of leptin (pg/mL) in fed TrkB.T1 KD (n = 8) and control animals (n = 7). Students unpaired two-sided t-test, *, p = 0.002. i, Percent body weight change after 3 consecutive days of twice daily 3 ug/g leptin administration in TrkB.T1 KD (n = 14) and control males (n = 10). Students unpaired two-sided t-test, *, p = 0.003. j, Percent change in food intake from baseline (3-day vehicle administration) following 3 days of leptin administration (Control n = 6, TrkB.T1 KD n = 9). Student’s unpaired two-sided t-test, *, p = 0.009. k, Quantification of pSTAT3+ cells in TrkB.T1 mutant (n = 7) and control (n = 5) males 5 weeks post-surgery and 45 minutes post 5 ug/g leptin IP administration. Student’s t-test, *, p = 0.0003. h, Representative image of pSTAT3 expression in VMH 45 minutes post 5 ug/g leptin IP administration. Scale bar is 50 uM. Data represented as mean +/− SEM.