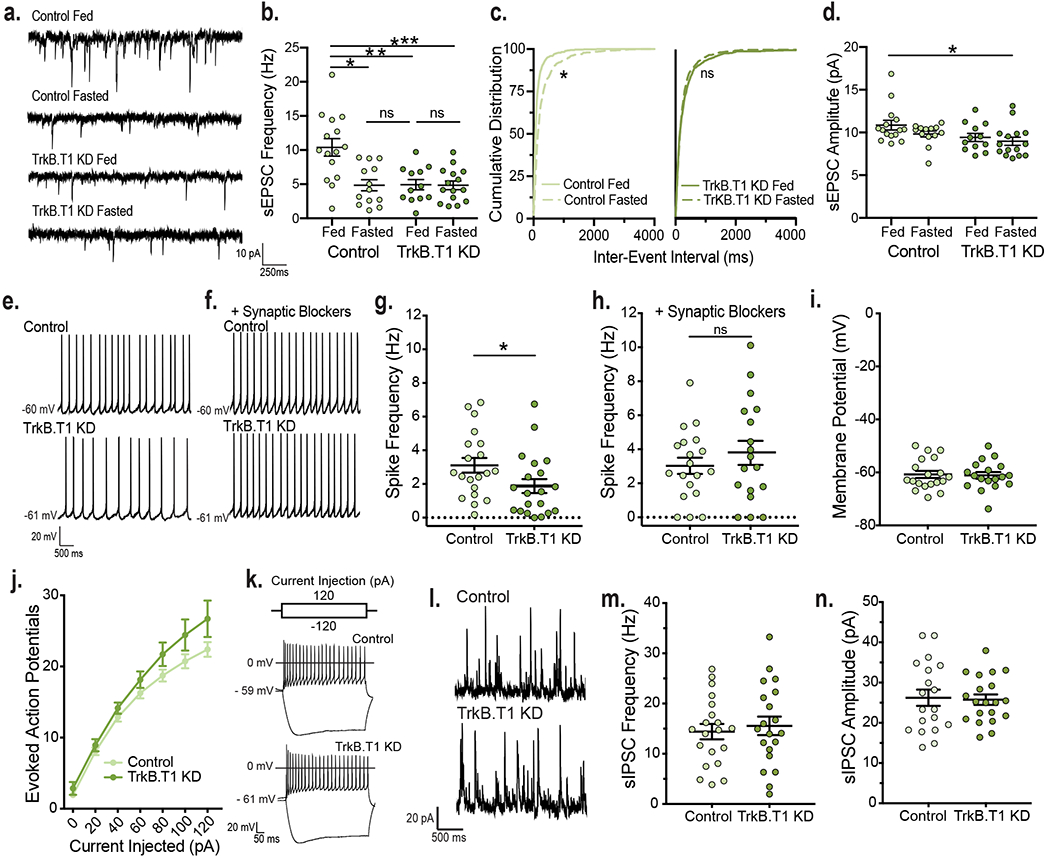
Figure 5: Depletion of TrkB.T1 from VMH astrocytes of adult mice decreases neuronal activity.

a, Representative traces and b, sEPSC frequency from fed (n = 12 cells) and fasted (n = 15 cells) TrkB.T1 KD and fed (n = 15 cells) and fasted (n = 13 cells) control animals (from 4 – 5 mice per group). Ordinary Two-way ANOVA; Genotype, p = 0.004; Energy Status, p = 0.004; Interaction of Genotype and Energy Status, p = 0.005. Tukey multiple comparisons, *, p = 0.0005; **; p = 0.0008; ***, p = 0.0003 . c, Cumulative distributions of inter-event interval generated from 50 random events per recorded cell for Control fed and fasted (*, p < 0.0001, KS = 0.30, Kolmogorov-Smirnov, two-sided) and TrkB.T1 KD fed and fasted mice (*, p = 0.25, KS = 0.05, Kolmogorov-Smirnov, two-sided). d, sEPSC amplitude (Control Fed n = 15 cells; Control Fasted n = 13 cells; TrkB.T1 KD Fed n = 12 cells; TrkB.T1 KD Fasted n = 15 cells, from 4 – 5 mice per group). Ordinary Two-way ANOVA; *, Genotype, p = 0.0216; Energy Status, p = 0.129; Interaction of Genotype and Energy Status, p = 0.55. e, Representative traces of spike frequency in the absence f, and presence of synaptic blockers. g, Spike frequency (Hz) of VMH neurons from fed control and TrkB.T1 KD males (n = 20 cells, from 5 - 6 mice per group). Students unpaired two-sided t-test, *, p = 0.04. h, Spike frequency of VMH neurons from fed TrkB.T1 KD (n = 18) and control (n = 19) (4 mice per group) males in the presence of synaptic blockers 10 uM SR 95531, 50 uM NBQX and 10 uM CPP. Student’s unpaired two-sided t-test, NS. i, Membrane potential of VMH neurons from fed TrkB.T1 KD (n = 18) and control (n = 19) (4 mice per group) mice in the presence of synaptic blockers. Student’s unpaired two-sided t-test, NS. j, Input-output curves of VMH neurons from fed TrkB.T1 KD (n = 14) and control (n = 15) mice (4 – 6 mice per group). Two-way RM ANOVA: Interaction, p = 0.2; Genotype, p = 0.09. k, Representative traces. l, Representative traces and m, Frequency (Hz) and n, amplitude of sIPSC from fed control and TrkB.T1 KD VMH neurons (n = 20 cells, 4 – 5 mice per group). Student’s unpaired two-sided t-test, NS. Data represented as mean +/− SEM.
