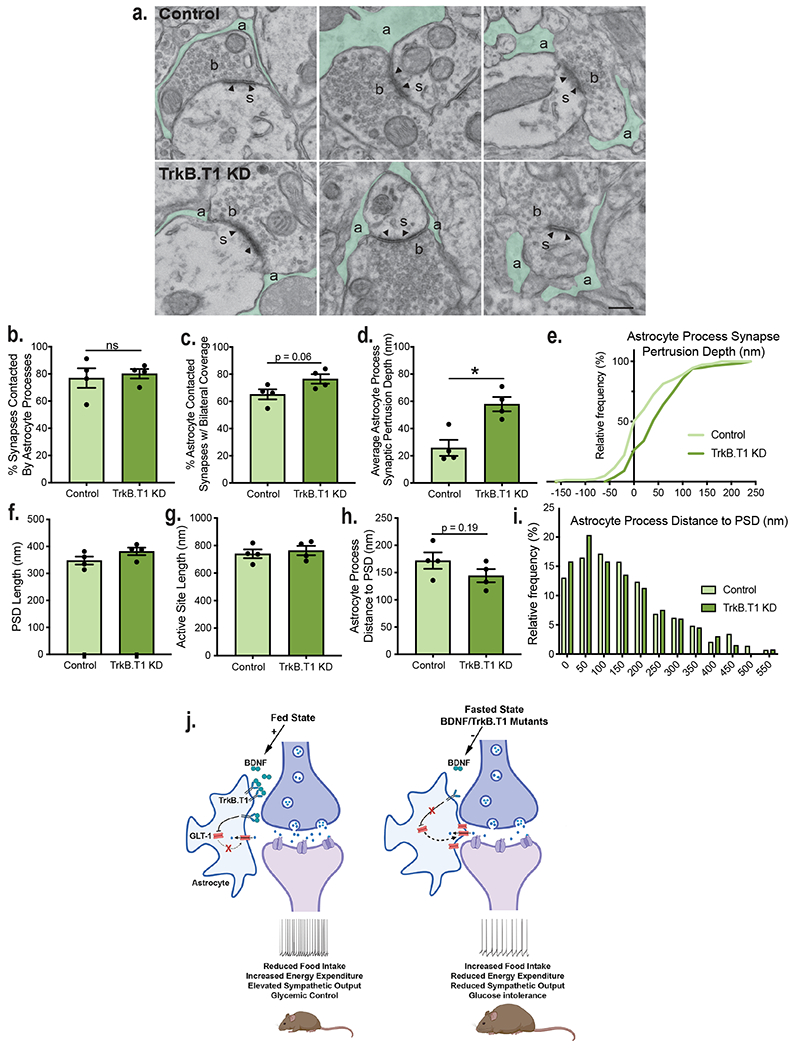
Figure 7: Knockdown of TrkB.T1 in VMH astrocytes increases astrocyte invasion of VMH synapses.

a, Representative electron microscopy images showing astrocyte processes (a, green) surrounding VMH synapses in control and TrkB.T1 KD mice 5 weeks post-surgery. Axonal bouton (b), dendritic spine (s), post-synaptic density (arrowhead). Scale bar 250 nm. For all of following panels, analysis was performed in control (n = 198 synapses) and TrkB.T1 KD (n = 166 synapses) animals (n = 4). b, Percentage of synapses contacted by astrocyte processes. Student’s unpaired two-sided t-test, NS. c, Percentage of astrocytes contacting synapses bilaterally. Students unpaired two-sided t-test, p = 0.06. d, Astrocyte process protrusion depth (nm) into synapses. Students unpaired two-sided t-test, *, p = 0.006. e, Cumulative distribution of astrocyte process synaptic protrusion depth (p < 0.0001, KS = 0.2912, Kolmogorov-Smirnov, two-sided). f, Post-synaptic density length (nm). g, Active site length (nm). h, Astrocyte process distance to the post-synaptic density. Students unpaired two-sided t-test, p = 0.19. i, Histogram of astrocyte process distance to post-synaptic density (p = 0.3, KS = 0.1165. Kolmogorov-Smirnov, two-sided). j, Model of how caloric status and BDNF signaling regulate the structural and functional plasticity of VMH astrocytes to regulate neuronal activity and energy and glucose balance. Created with Biorender.com. Data are represented as mean +/− SEM.
