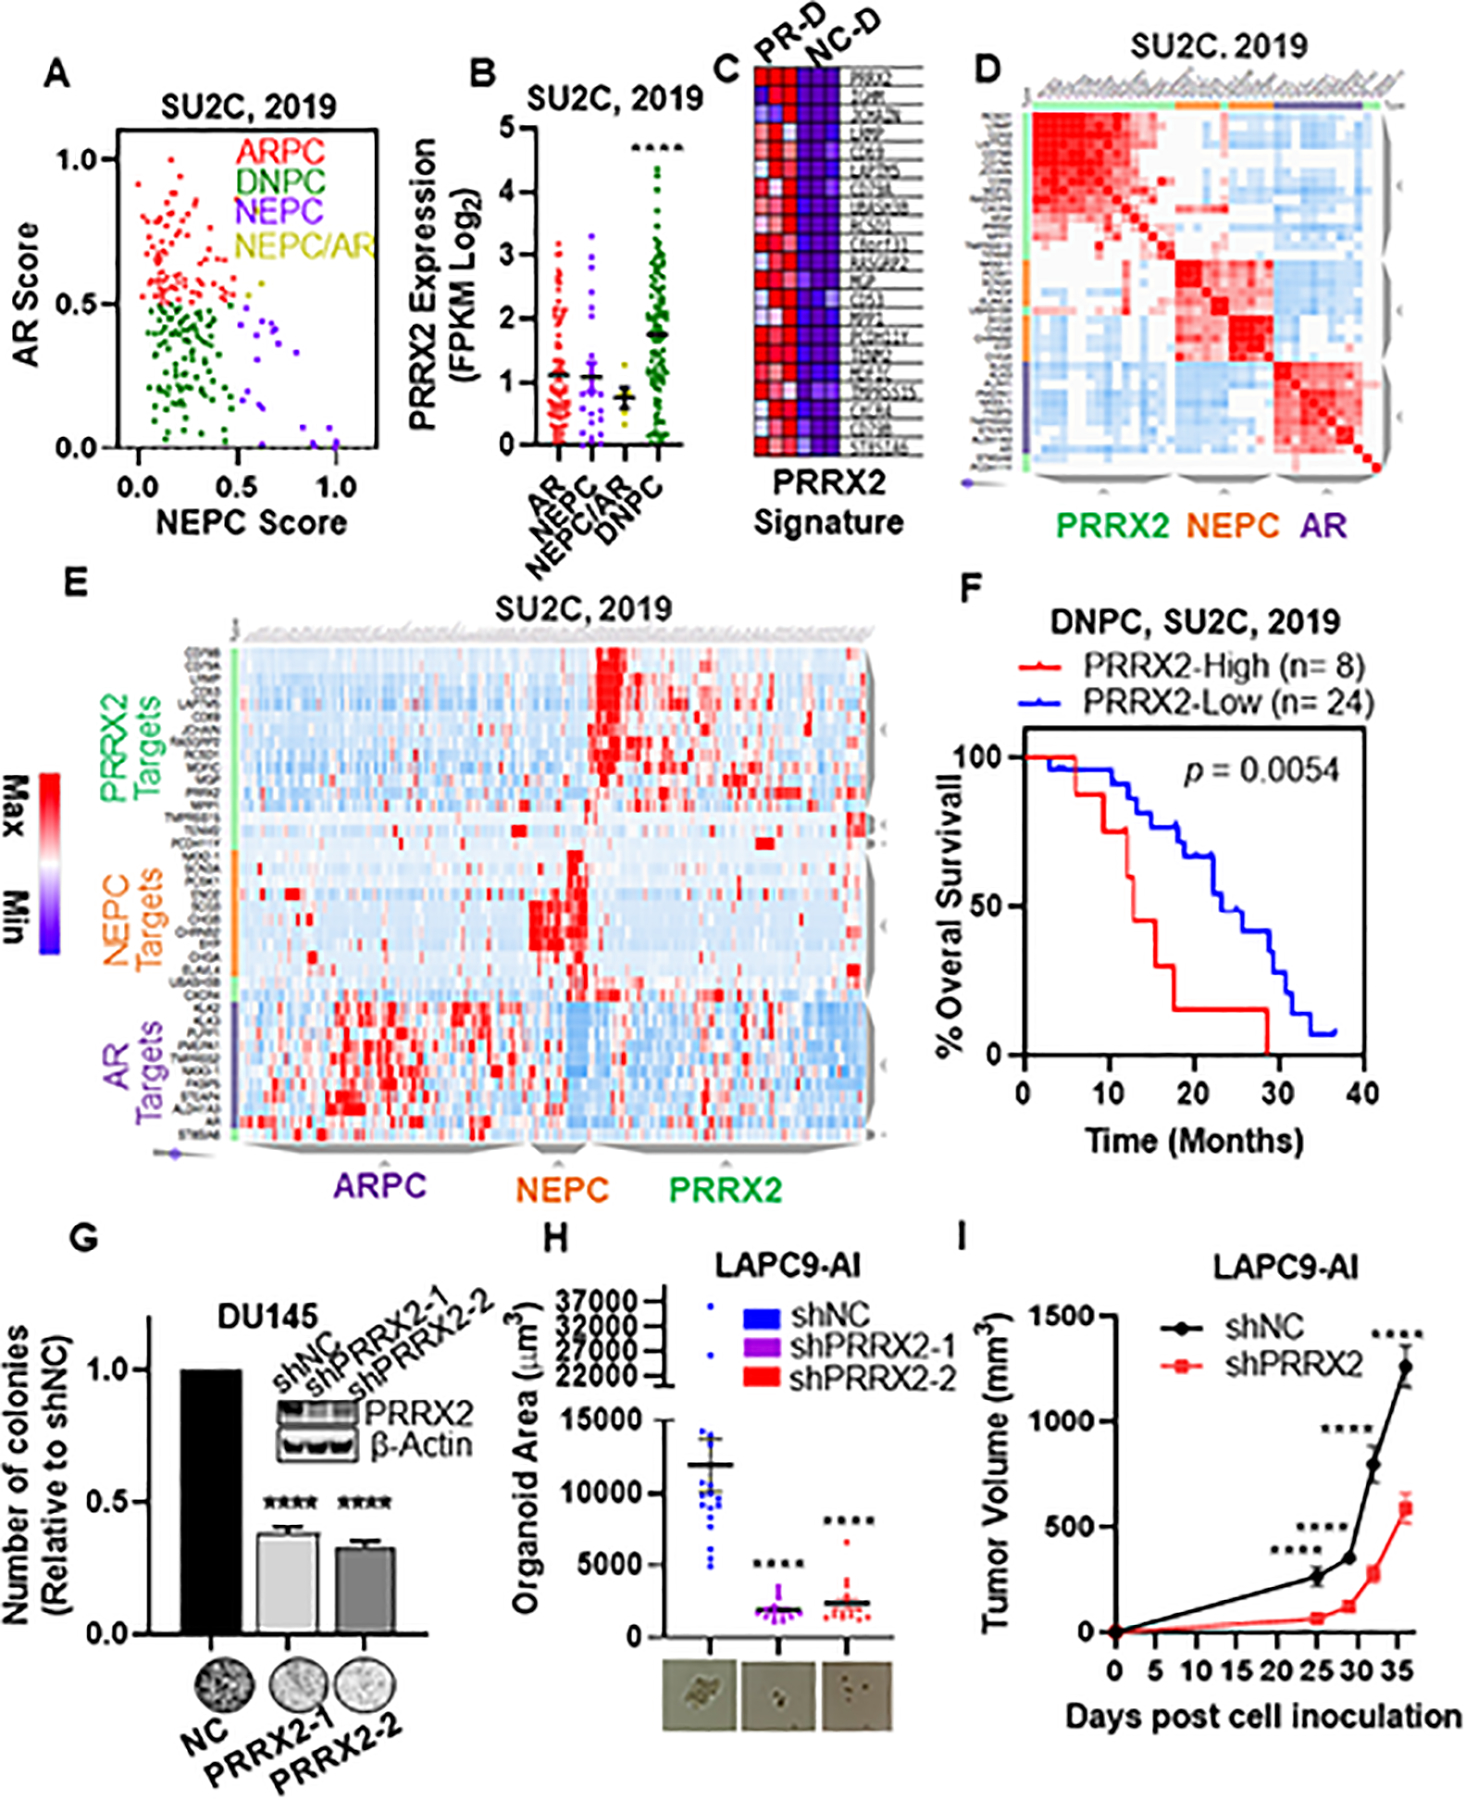
Fig. 5. PRRX2 expression and a PRRX2 signature are elevated in DNPC.

A) Scatter plot of AR and NEPC scores within the SU2C patient dataset. ARPC defined as AR Score < 0.5 and NEPC Score <0.5 (n=85). NEPC defined as NEPC Score > 0.5, AR Score < 0.5 (n=22). DNPC defined as AR score < 0.5 and NEPC score < 0.5 (n=71). ARPC/NEPC defined as both AR Score and NEPC score >0.5 (n= 5). B) PRRX2 expression levels in ARPC, NEPC, NEPC/ARPC and DNPC subgroups. C) Heatmap of the top 21 differentially expressed genes between LNCaP-sgNC-DMSO (NC-D) and LNCaP-sgPRRX2-DMSO (PR-D) used for the PRRX2 signature. D) Similarity matrix of patients in the SU2C cohort using AR, NEPC and PRRX2 signature genes. E) Hierarchical clustering of the SU2C, 2019 patients according to the expression of AR, NEPC and PRRX2 signature genes. F) Overall survival plot of DNPC patients classified into PRRX2 high (25th percentile of PRRX2 score) and PRRX2 low (rest of the patients). G) Colony formation assay of DU145 after PRRX2 knockdown using two different shRNAs. Experiment performed in 3 independent biological replicates H) LAPC9-AI organoid size after PRRX2 knockdown with two different shRNAs. Experiment performed in 3 independent biological replicates I) Tumor growth of LAPC9-AI-shNC and LAPC9-AI-shPRRX2–1 inoculated into castrated mice. Clustering: D, E Clustergrammer was used to build the matrix using 1-cosine distance and average linkage. Statistical analysis: Log-rank analysis used for survival analysis. Unpaired two tail t-test for G, H, I. Error bars represent S.E.M. *p < 0.05; **p < 0.01; ***p < 0.001; ****p < 0.0001
