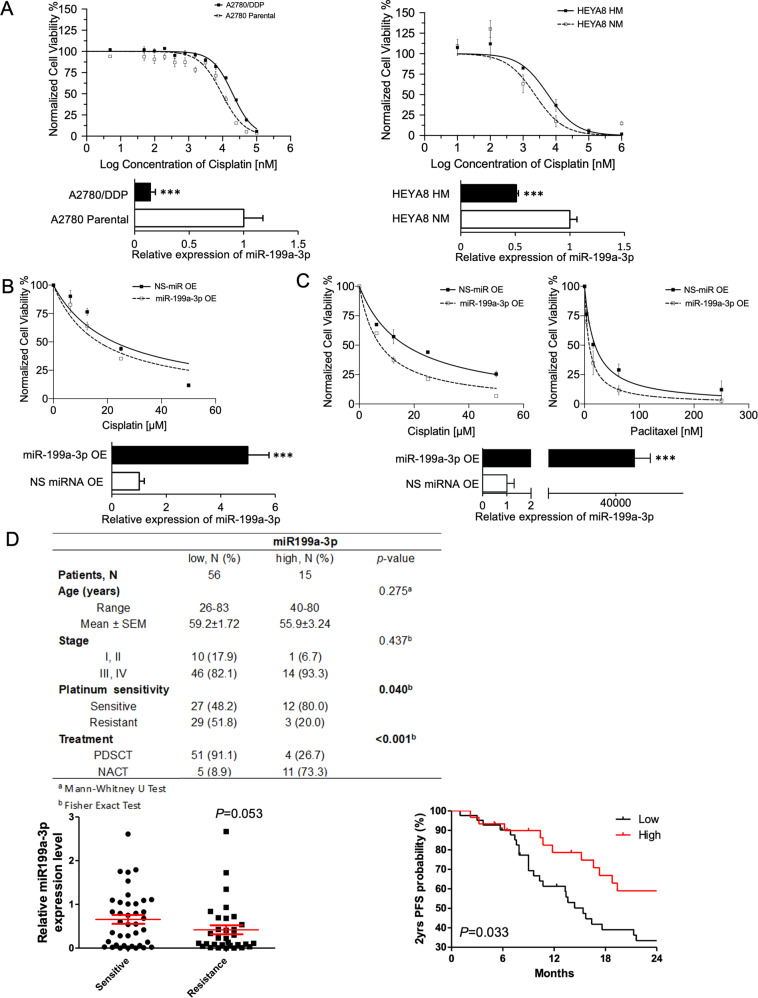
Fig. 5. miR-199a-3p enhances chemosensitivity and stemness in ovarian cancer cells.
A Dose–response curve of A2780 Parental vs. A2780/DDP cells (left), and HEYA8 HM vs. HEYA8 NM cells (right) against cisplatin. B Dose–response curve of miR-199a-3p-overexpressing A2780/DDP cells (left) against cisplatin and C against cisplatin/paclitaxel for SKOV-3 cells (right). The miR-199a-3p-overexpressing SKOV-3 cells were divided into two groups: cisplatin and paclitaxel treatment. D Expression of miR-199a-3p in chemosensitive vs. chemoresistant patient tumors and Kaplan–Meier Survival analysis for patient stratified by miR-199a-3p expression, and clinicopathological table of patients. Bar graph values are mean ± SD, n = 3. T-test. *P < 0.05, **P < 0.005. Statistical analysis for patient samples is mentioned in clinicopathological table.

