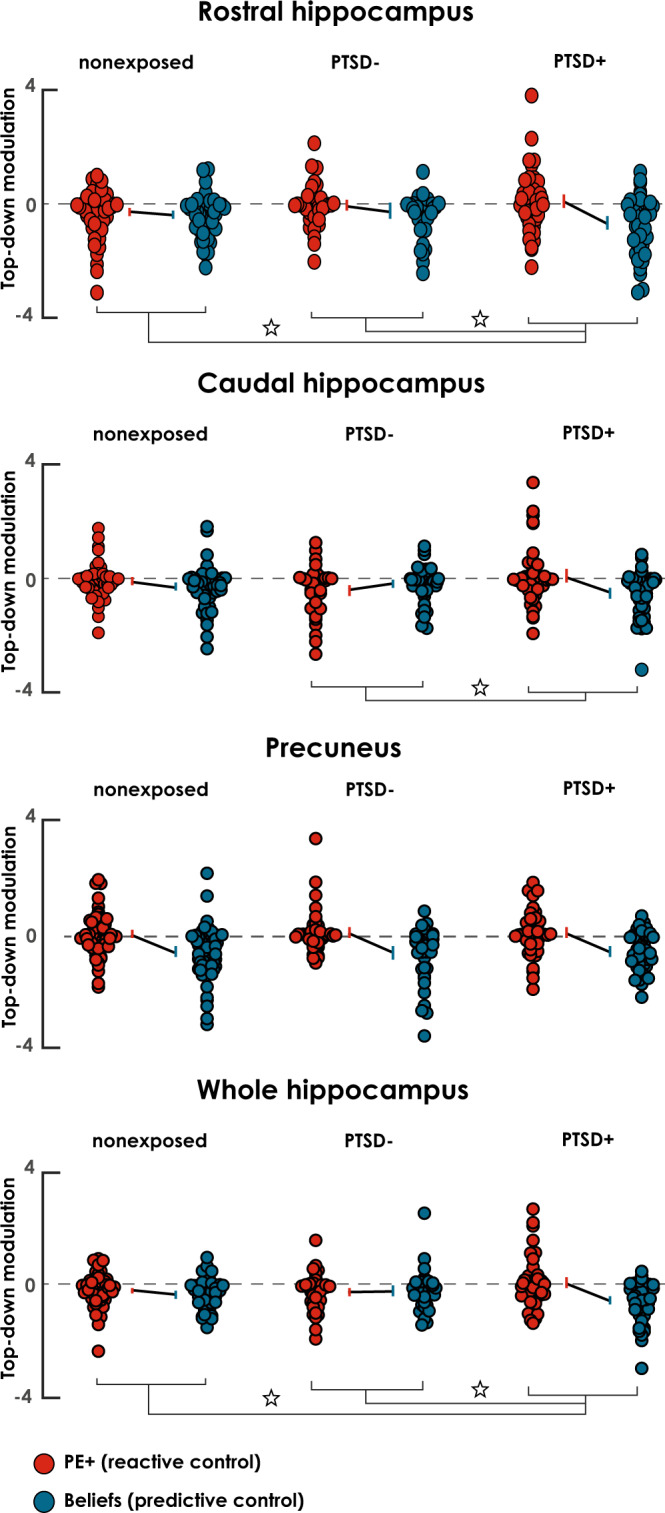
Fig. 4. BMA of top-down coupling parameters during belief- and PE-driven suppression.

Red and blue circles represent the modulation of PE+ and beliefs on the top-down coupling between the MFG and the target regions, respectively, in non-exposed (n sample size = 72), PTSD− (n sample size = 46) and PTSD+ (n sample size = 55). Lines represent group average coupling parameters ± bootstrapped 95% CI of the group mean, and small circles represent individual participant coupling parameters. ‘*’ indicates significant interaction between groups and the balance in belief-driven predictive and PE-driven reactive control as shown by one-tailed t-tests at pFDR < 0.05. See Table 1 for statistical details.
