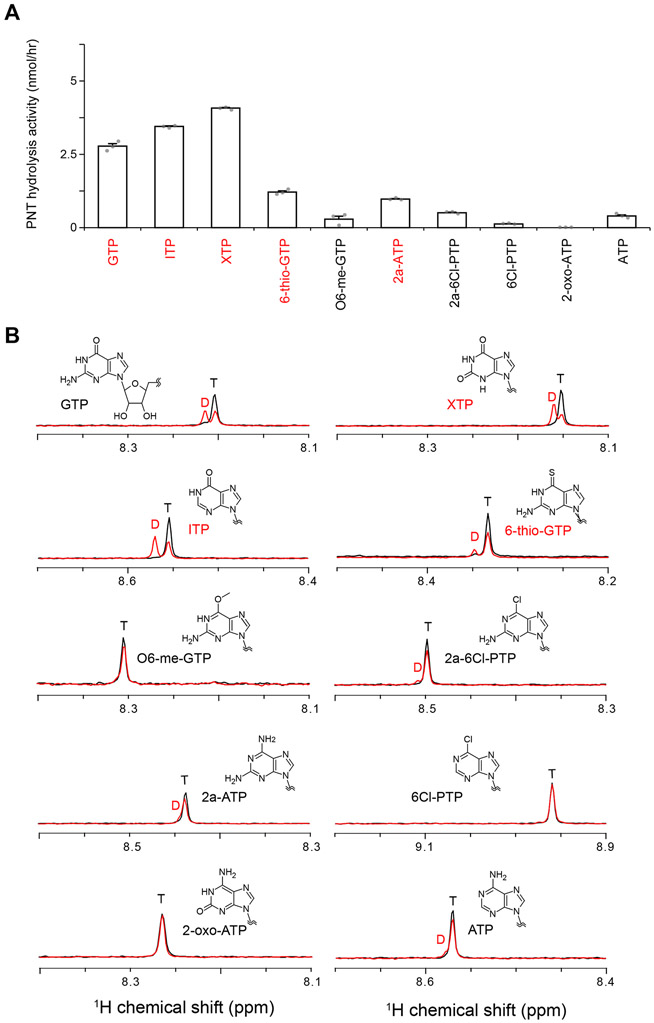
Figure 6. PNT hydrolysis activity of PI5P4Kβ.
(A) PNT hydrolysis activity of PI5P4Kβ. The PNT hydrolysis activity (nmol/hr) of PI5P4Kβ was calculated from the signal intensities of diphosphorylated and triphosphorylated nucleotides NMR signals after the reaction (see Star Methods and panel B). In the PNT-hydrolysis assay, 250 μM PNTs were mixed with 2 μM PI5P4Kβ. The average values from three experiments are shown with error bars (standard deviations; S.D.). The values from each experiment are shown as gray dots. Highly hydrolyzed nucleotides (> 0.1 of the ratios) are indicated by red. (B) Representative spectra in the NMR-based PNT hydrolysis assay. The intensities of H8 protons of diphosphorylated (D)/triphosphorylated (T) nucleotide signals are quantified from the spectra. See also Fig. S3.

