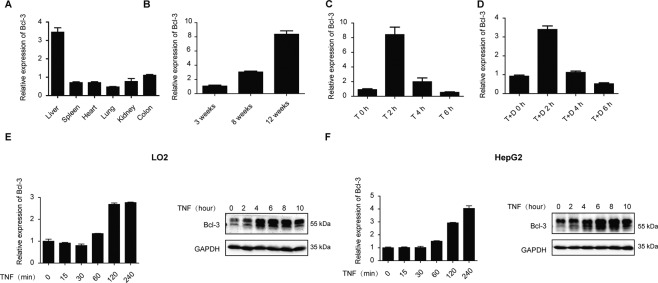
Fig. 1. TNF-induced upregulation of Bcl-3 in the liver.
A qPCR analysis of bcl-3 in different organs of wild-type mice. B qPCR analysis of bcl-3 in livers from wild-type mice at different ages. C qPCR analysis of bcl-3 expression in the livers following treatment with TNF. D qPCR analysis of bcl-3 expression in the liver following treatment with TNF and D-GalN. E Bcl-3 expression was analyzed by qPCR and western blotting in LO2 cells. F Bcl-3 expression was analyzed by qPCR and western blotting in HepG2 cells. Abbreviations are as follows: T, TNF (20 mg/kg); T + D, TNF (10 mg/kg) +D-GalN (700 mg/kg).

