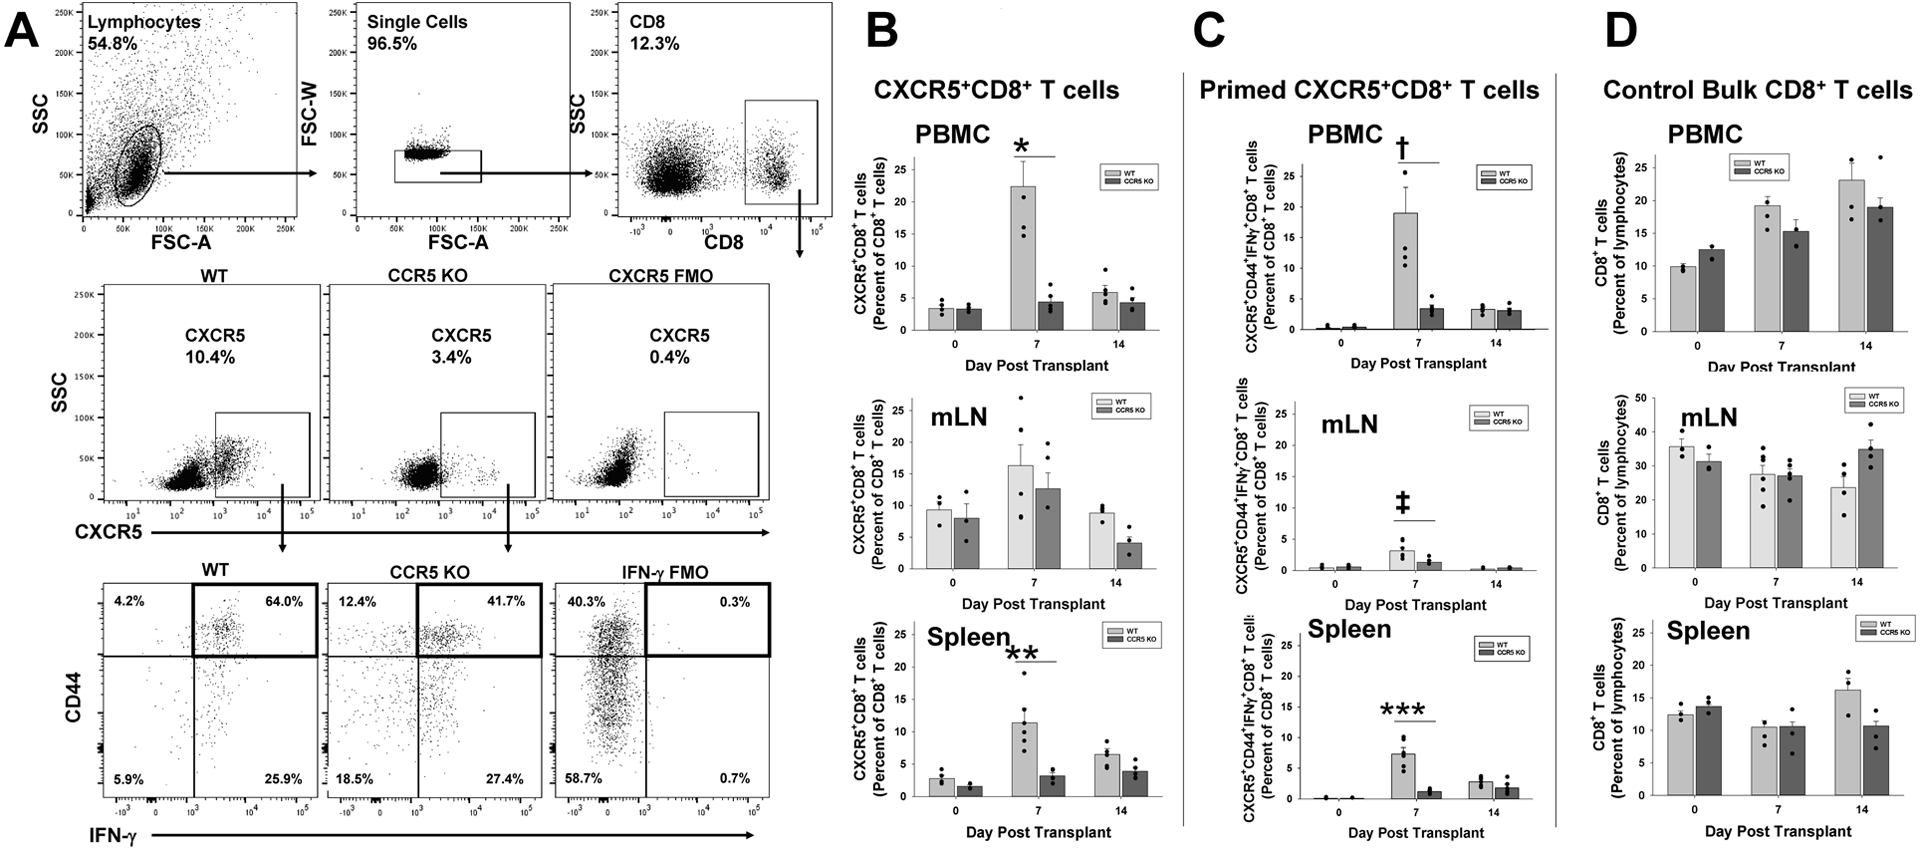
Figure 2. The peak proportion of CXCR5+CD8+ T cells (and activated CXCR5+CD44+IFN-γ+CD8+ T cells) after kidney transplant is severely reduced in CCR5 KO compared to WT recipients.

CCR5 KO and C57BL/6 (wild-type, WT; both H-2b) mice were transplanted with A/J (H-2a) kidney. Peripheral blood, mesenteric lymph node (mLN), and splenocytes were retrieved from cohorts of mice prior to transplant and on days 7 and 14 posttransplant. CD8+ T cells were analyzed by flow cytometry. A) Flow cytometric gating was on lymphocytes, single cells, CD8+ T cells, and CXCR5. Fluorescent minus one was used as a negative control. Representative flow panels of CXCR5+CD8+ and CXCR5+CD44+IFN-γ+CD8+ T cells from splenocytes of WT and CCR5 KO mice are shown. B) On day 7, CCR5 KO recipients compared to WT recipients have a significantly lower proportion of CXCR5+CD8+ T cells in the peripheral blood (4.4±0.8% vs. 22.4±3.5%; *p<0.0001) and spleen (3.2±0.4% vs. 11.4±1.7%; n=5 for both strains; **p<0.0001); however, no difference was detected in mLN (12.6±2.5% vs. 16.3±3.3%; p=ns). C) On day 7, CCR5 KO recipients compared to WT recipients have a significantly lower proportion of activated CXCR5+CD44+IFN-γ+CD8+ T cells in the peripheral blood (3.4±0.5% vs.19.0±3.8%; †p<0.0001), mLN (1.3±0.3% vs. 3.2±0.5%; ‡p<0.01) and spleen (1.2±0.1% vs. 7.3±0.9%; n=5 for both strains; ***p<0.0001). D) No significant difference in percentages of peripheral blood, mLN, or splenic CD8+ T cells in WT and CCR5 KO recipients was observed at any time point (p=ns).
