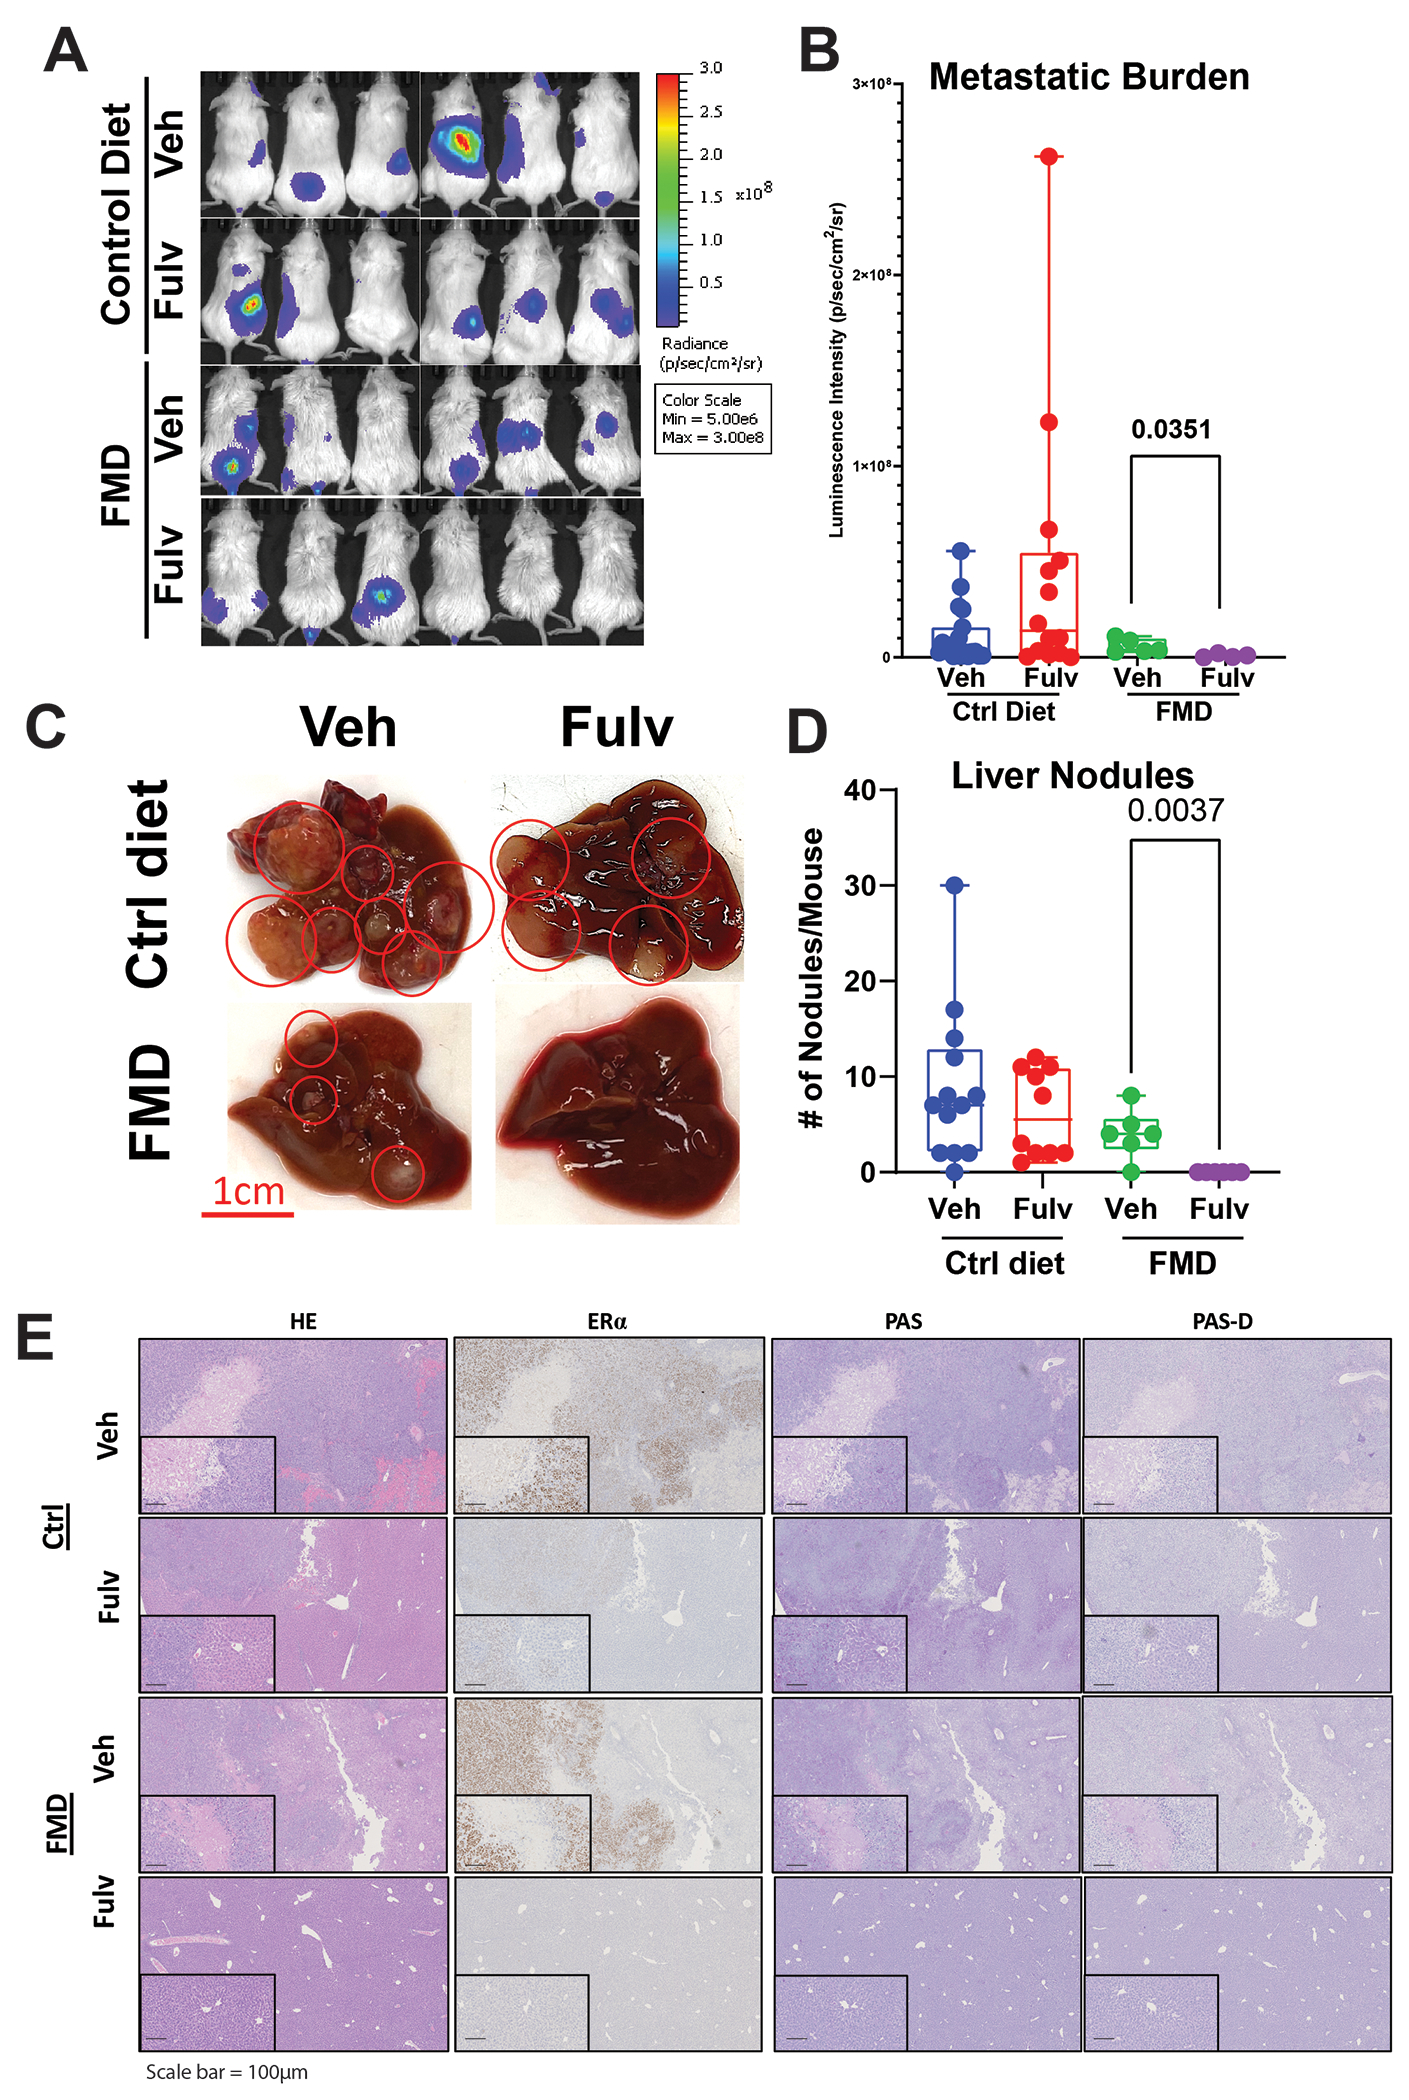
Figure 6: FMD diet synergizes with Fulv to reduce MCF7-ESR1Y537S liver metastatic burden and number of nodules.

A, B) NSG mice with MCF7-ESR1Y537S xenografts were fed control diet or FMD. Mice were treated with Veh or Fulv. Bioluminescence imaging of tumors was measured by IVIS. (Image for the control group is same as the image for Figure 4B) C) Representative images of livers from mice in different treatment groups. D) Liver metastatic nodules were counted at necropsy. One-way ANOVA, Dunn’s multiple comparison test, *p<0.05. E) Histological analysis of tumors from (C). HE, ERα, PAS, and PAS-D IHC staining were performed.
