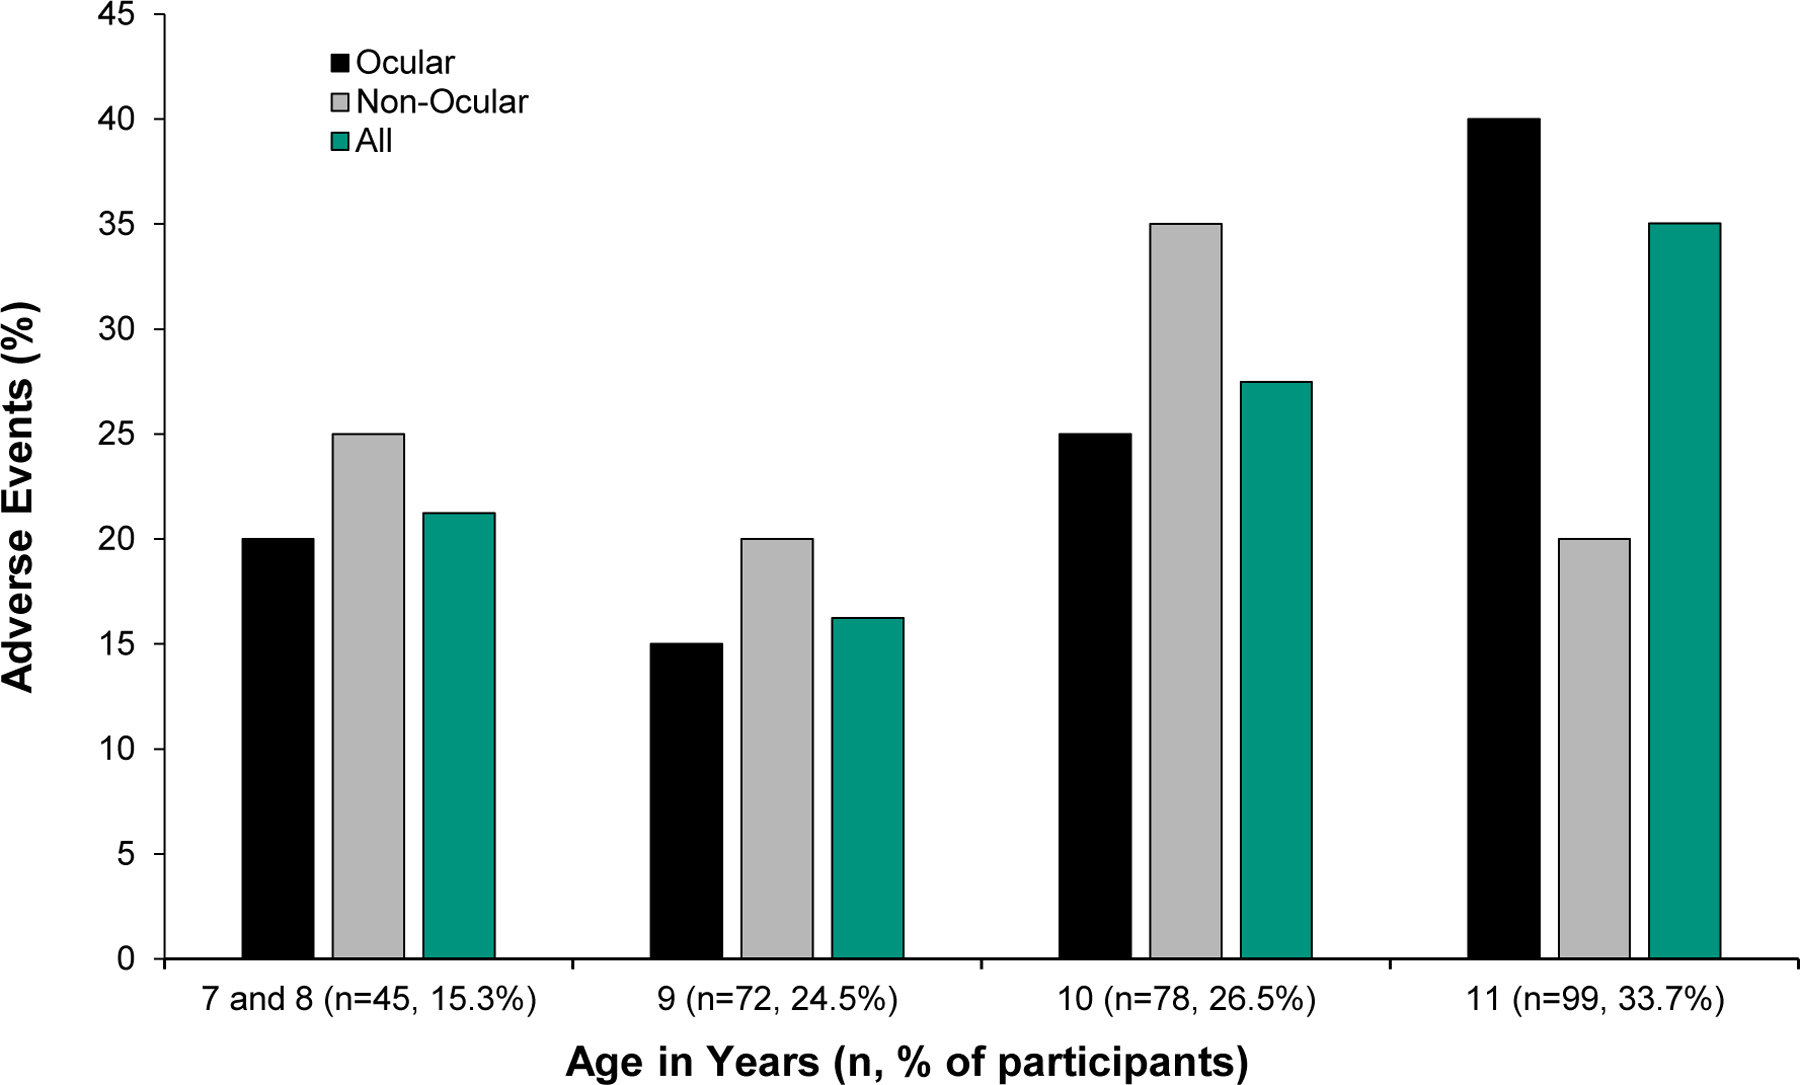
Figure 1.

Percentage of participants by baseline age group that experienced ocular, non-ocular, and all adverse events. The percent of the total number of children in each age group is indicated in the x-axis labels. Age is not associated with adverse events, so the proportion of adverse events in each age group is similar to the proportion of participants in each age group.
