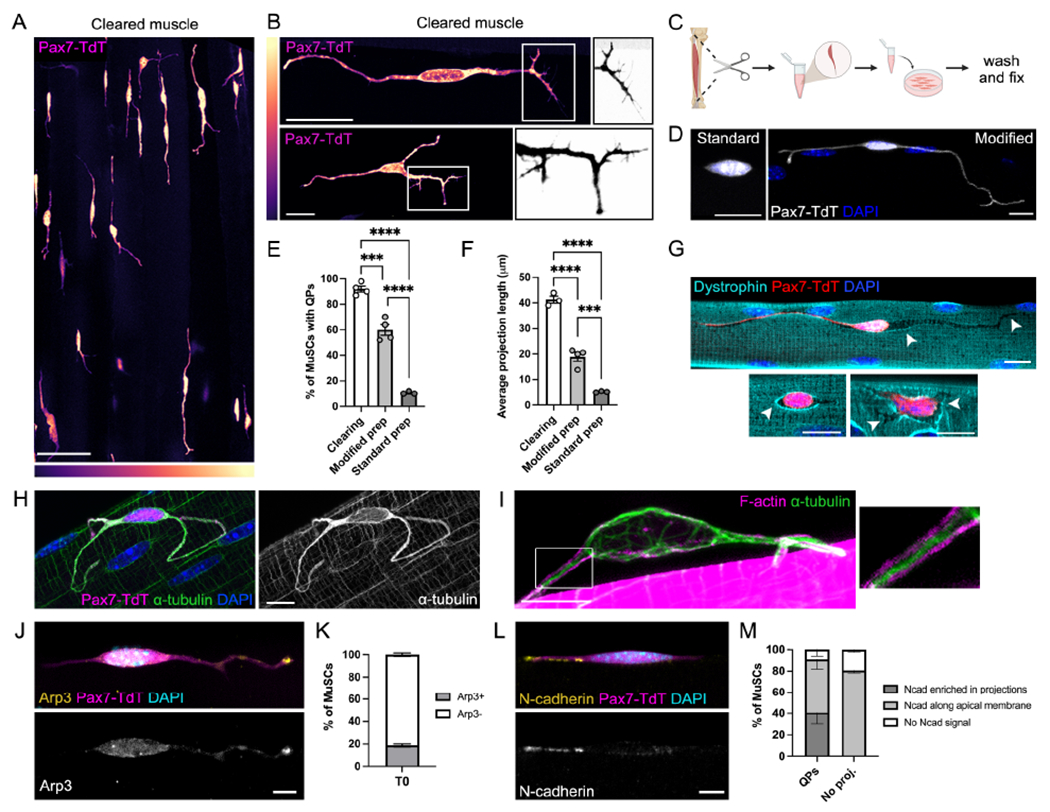
Figure 1. Quiescent MuSCs have long projections resembling motile structures.

(A-B) Cleared EDL muscle from Pax7CreERr2;R26LSL-TdTom(Pax7-TdT) mice showing quiescent projections (QPs) in uninjured muscle (A) and individual MuSCs (B). Boxed regions in (B) are inverted and decolorized to show filopodia. LUTs indicate signal intensity. (C) Schematic showing single myofiber protocol. (D) MuSCs from the standard vs. modified myofiber protocol. (E-F) Quantifications of QP frequency (E) and lengths (F) from cleared muscle, modified, and standard myofiber preparations. (G-I) MuSCs showing grooves in the sarcolemma (G, arrowheads indicate sites of recent retraction), a dense α-tubulin network (H), and a cortical actin cytoskeleton in QPs (I). (J-M) Images and quantifications of Arp3 (J-K) or N-cadherin (L-M) localization in MuSCs. Data represent n=3-4 mice and show mean ± s.e.m.. Comparisons by one-way ANOVA with Bonferroni’s multiple comparisons test (E-F); ***= p<0.001, ****= p<0.0001. Scale bars: (A) 50μm; (B) 25μm; (D,G) 10μm; (H-I,J,L) 5μm. See also Figure S1.
