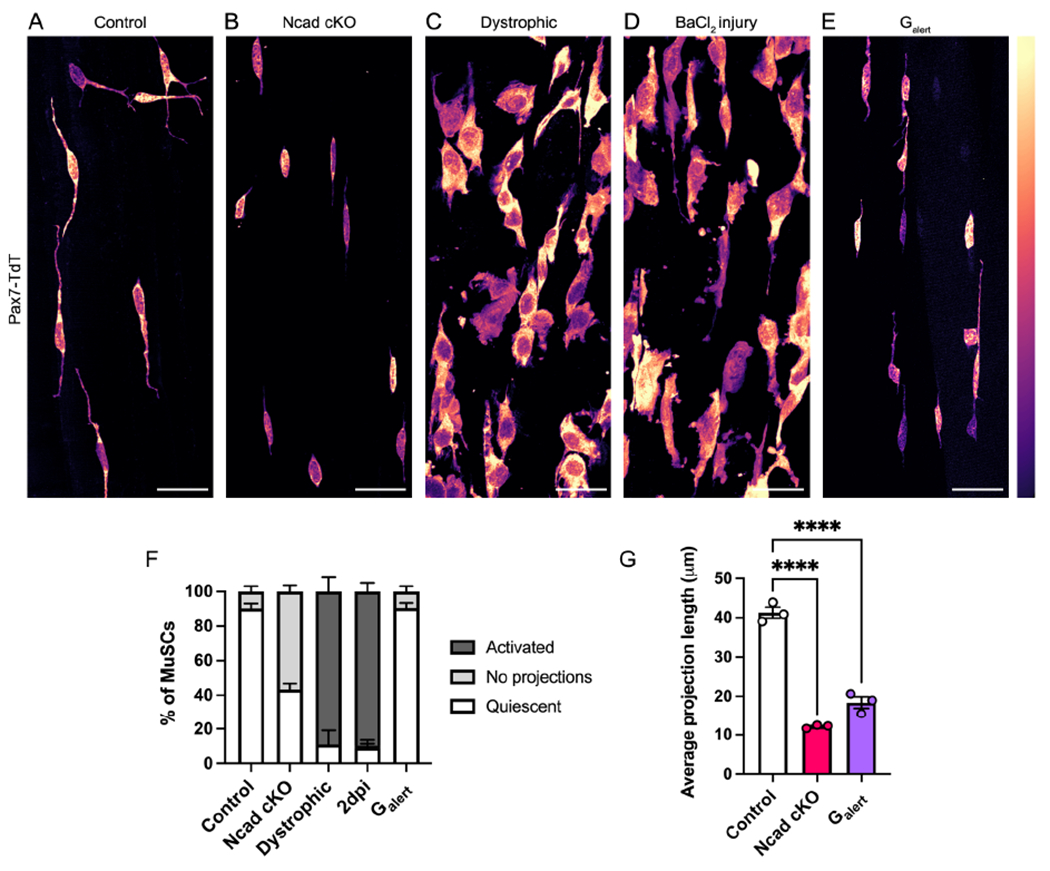
Figure 6. Projection dynamics are a conserved feature of muscle stem cell activation.

(A-E) Images of cleared EDL muscles from control (A), Cdh2fl/fl;Pax7CreERT2 (Ncad cKO) (B), Dmdmdx-4cv (dystrophic) (C), 2 days post-BaCl2 injury (D), and Galert (E) mice. (F-G) Quantifications of MuSC morphology across activation conditions (F) or average QP length (G). Data represent n=3 mice and show mean ± s.e.m.. Comparisons by one-way ANOVA with Bonferroni’s multiple comparisons test; ****=p<0.0001. Scale bars: 25μm.
