
Figure 1. Developmental trajectory of cortical thickness and surface area by group.
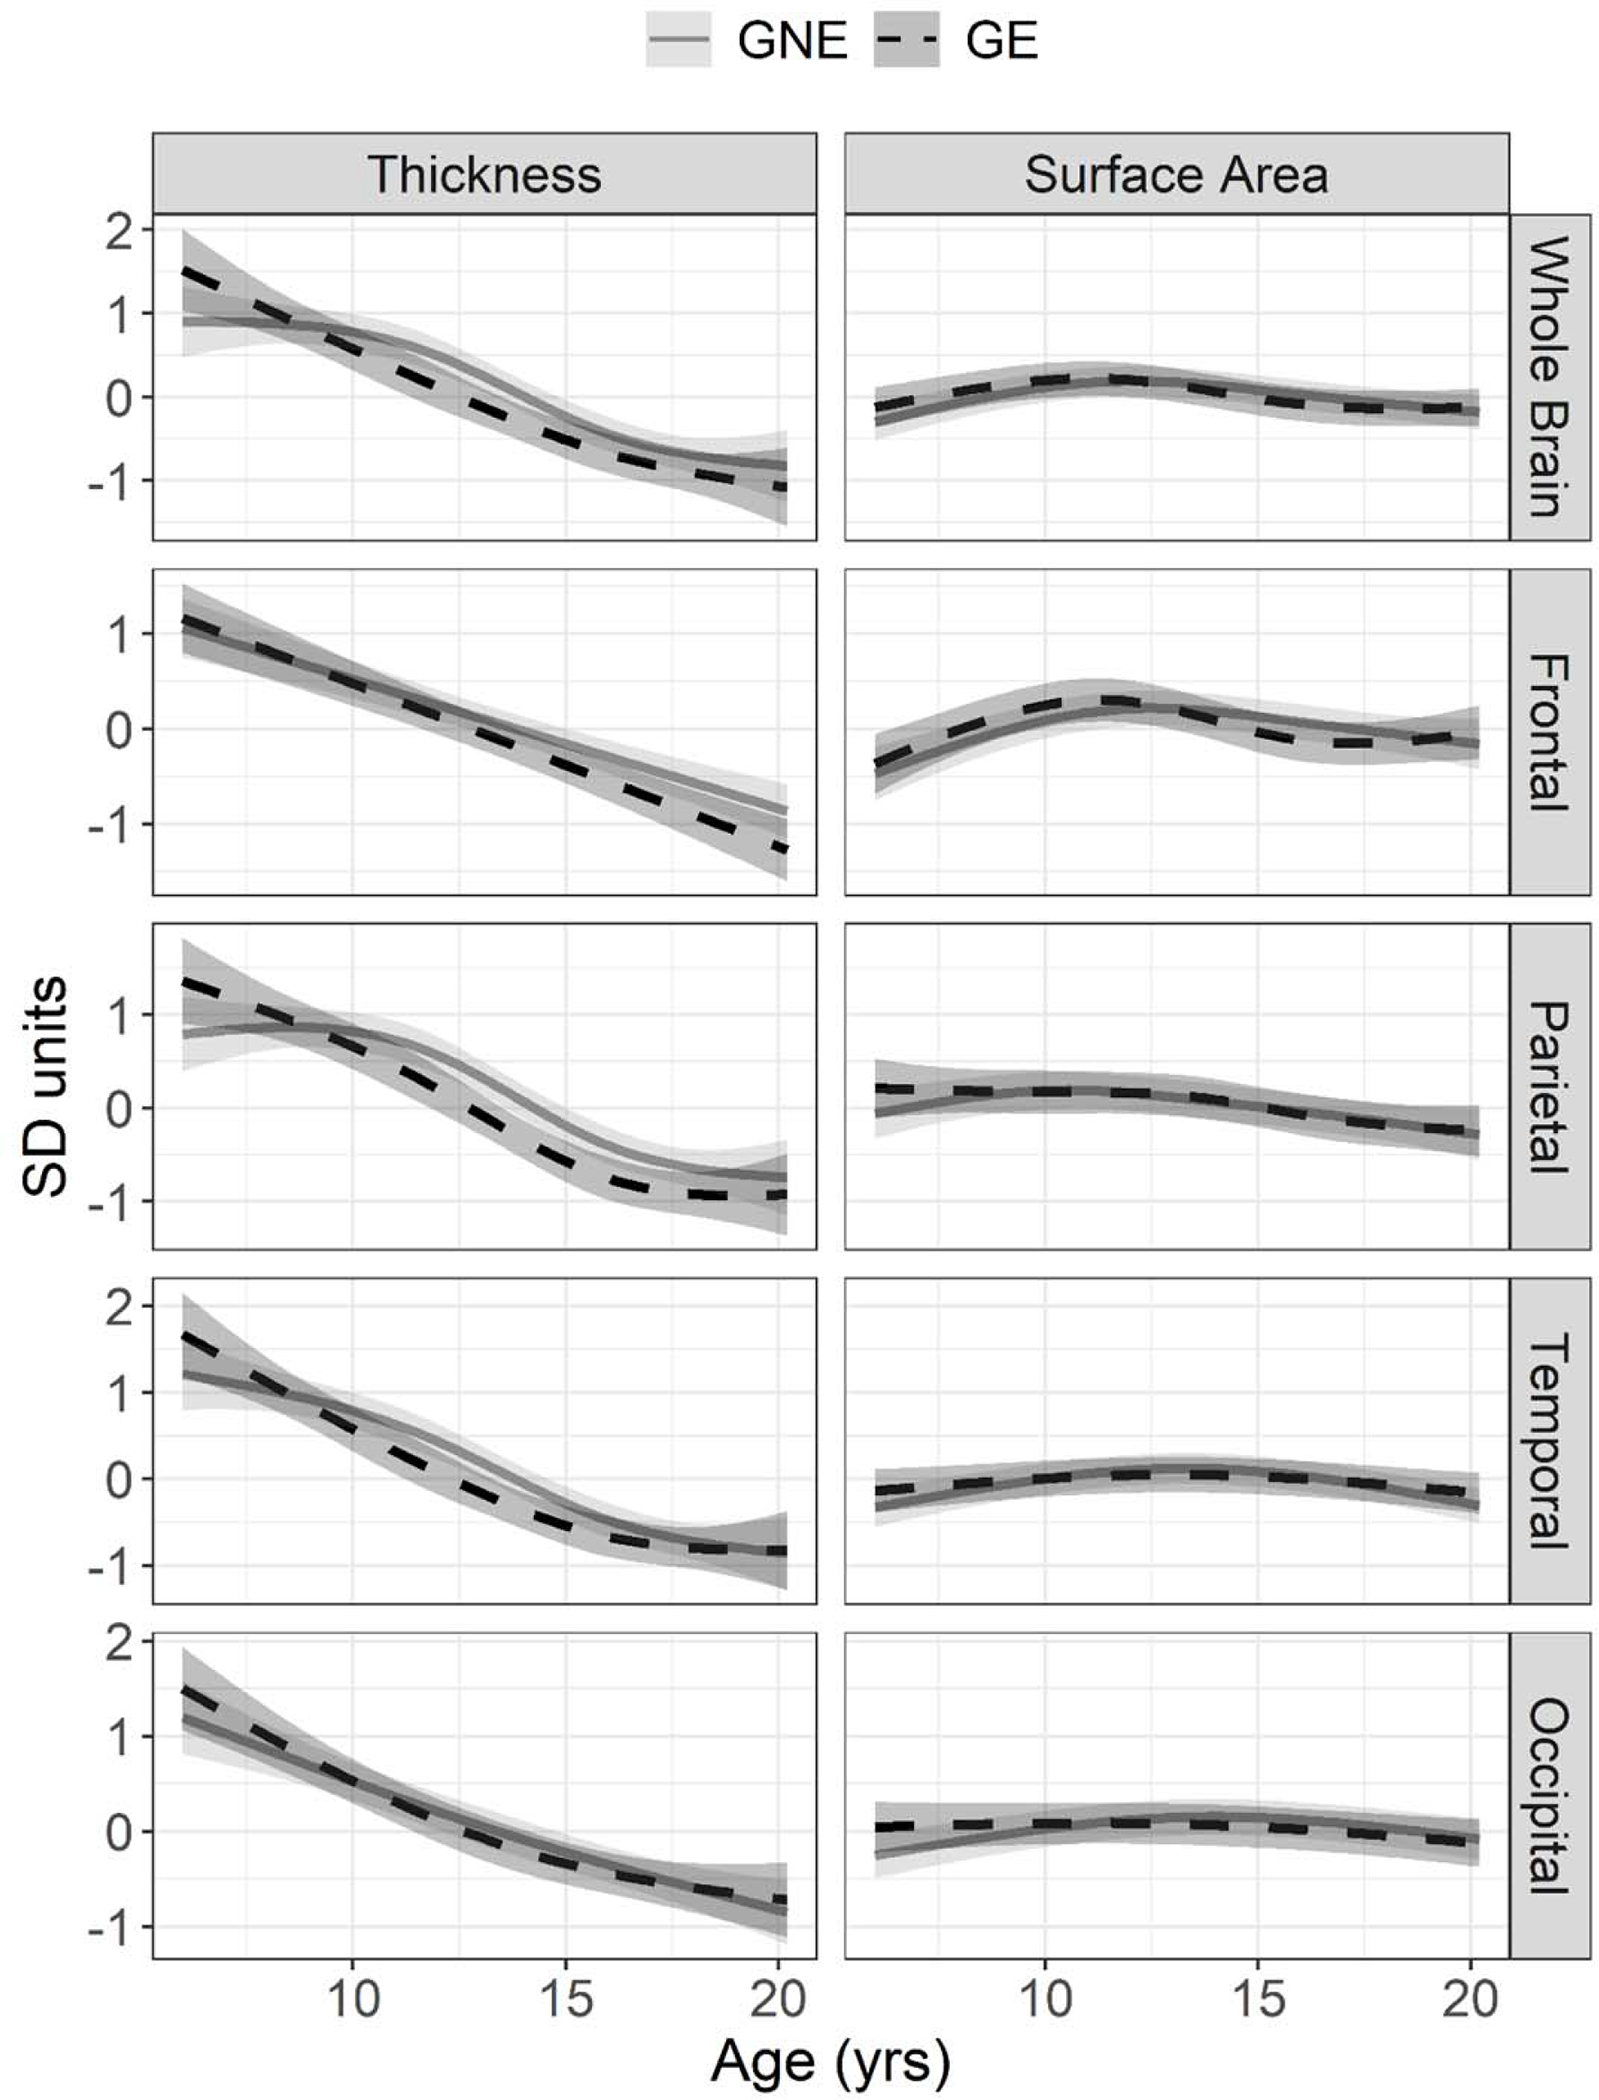
Mean estimated age-dependent change in cortical features in the gene non-expanded (GNE; grey) and gene-expanded (GE; black) groups. On the y-axis, cortical thickness (left) and surface area (right) are centered around sex-adjusted estimates from mixed effects models with natural cubic spline transformations of age.