. 2022 Apr 21;10(6):680–697. doi: 10.1158/2326-6066.CIR-21-0804

Figure 5.

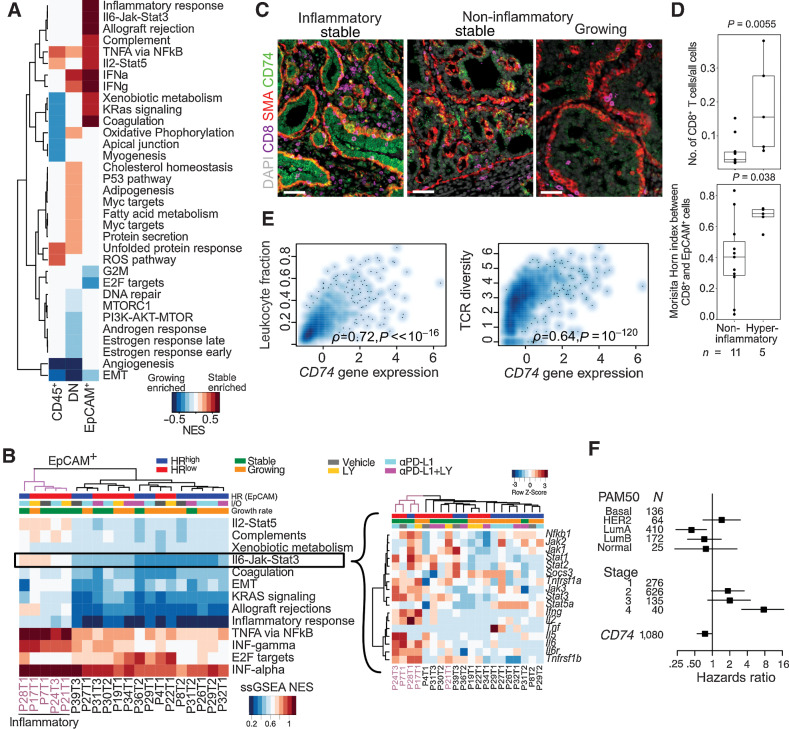
Figure 5. Molecular profiles of inflammatory tumor epithelial cells from immunotherapy-treated cohort of NMU-induced tumors. A, GSEA between growing versus stable tumors in CD45+, DN (double negative), and EpCAM+ cells using the MSigDB Hallmark compendium. Red and blue indicates stable and growing enriched, respectively, FDR < 0.05. B, Normalized single-sample gene set enrichment scores (ssGSEA NES) of significant pathways in EpCAM+ cells of each tumor. Inset, gene expression row z-scores of genes in the IL6–JAK–STAT3 signaling pathway. Hyperinflammatory tumors indicated in purple C, Immunofluorescence analysis of inflammatory and noninflammatory tumors for CD8, SMA, and CD74. Scale bar, 50  μm. D, Comparison of CD8+ T-cell frequency and intermixing with EpCAM+ cells in hyperinflammatory and noninflammatory tumors in WSI. Quartiles and range are shown. P values were calculated using Wilcoxon rank-sum test. E, Spearman correlation of CD74 expression with leukocyte infiltration and TCR diversity in TCGA breast cancer cohort (N = 1,054 complete observations). F, Forest plot showing HRs with 95% CIs from multivariable Cox regression analysis using CD74 gene expression z-score, PAM50 subtype and tumor stage in TCGA breast cancer cases. Log-rank test P value: 3 × 10⁻⁹. All tests for significance used Mann–Whitney–Wilcoxon test using a threshold of P = 0.05 unless otherwise specified; error bars representative of SD; box-whisker plots indicate 0th, 25th, 50th, 75th, and 100th percentiles.

Molecular profiles of inflammatory tumor epithelial cells from immunotherapy-treated cohort of NMU-induced tumors. A, GSEA between growing versus stable tumors in CD45+, DN (double negative), and EpCAM+ cells using the MSigDB Hallmark compendium. Red and blue indicates stable and growing enriched, respectively, FDR < 0.05. B, Normalized single-sample gene set enrichment scores (ssGSEA NES) of significant pathways in EpCAM+ cells of each tumor. Inset, gene expression row z-scores of genes in the IL6–JAK–STAT3 signaling pathway. Hyperinflammatory tumors indicated in purple C, Immunofluorescence analysis of inflammatory and noninflammatory tumors for CD8, SMA, and CD74. Scale bar, 50  μm. D, Comparison of CD8+ T-cell frequency and intermixing with EpCAM+ cells in hyperinflammatory and noninflammatory tumors in WSI. Quartiles and range are shown. P values were calculated using Wilcoxon rank-sum test. E, Spearman correlation of CD74 expression with leukocyte infiltration and TCR diversity in TCGA breast cancer cohort (N = 1,054 complete observations). F, Forest plot showing HRs with 95% CIs from multivariable Cox regression analysis using CD74 gene expression z-score, PAM50 subtype and tumor stage in TCGA breast cancer cases. Log-rank test P value: 3 × 10⁻⁹. All tests for significance used Mann–Whitney–Wilcoxon test using a threshold of P = 0.05 unless otherwise specified; error bars representative of SD; box-whisker plots indicate 0th, 25th, 50th, 75th, and 100th percentiles.