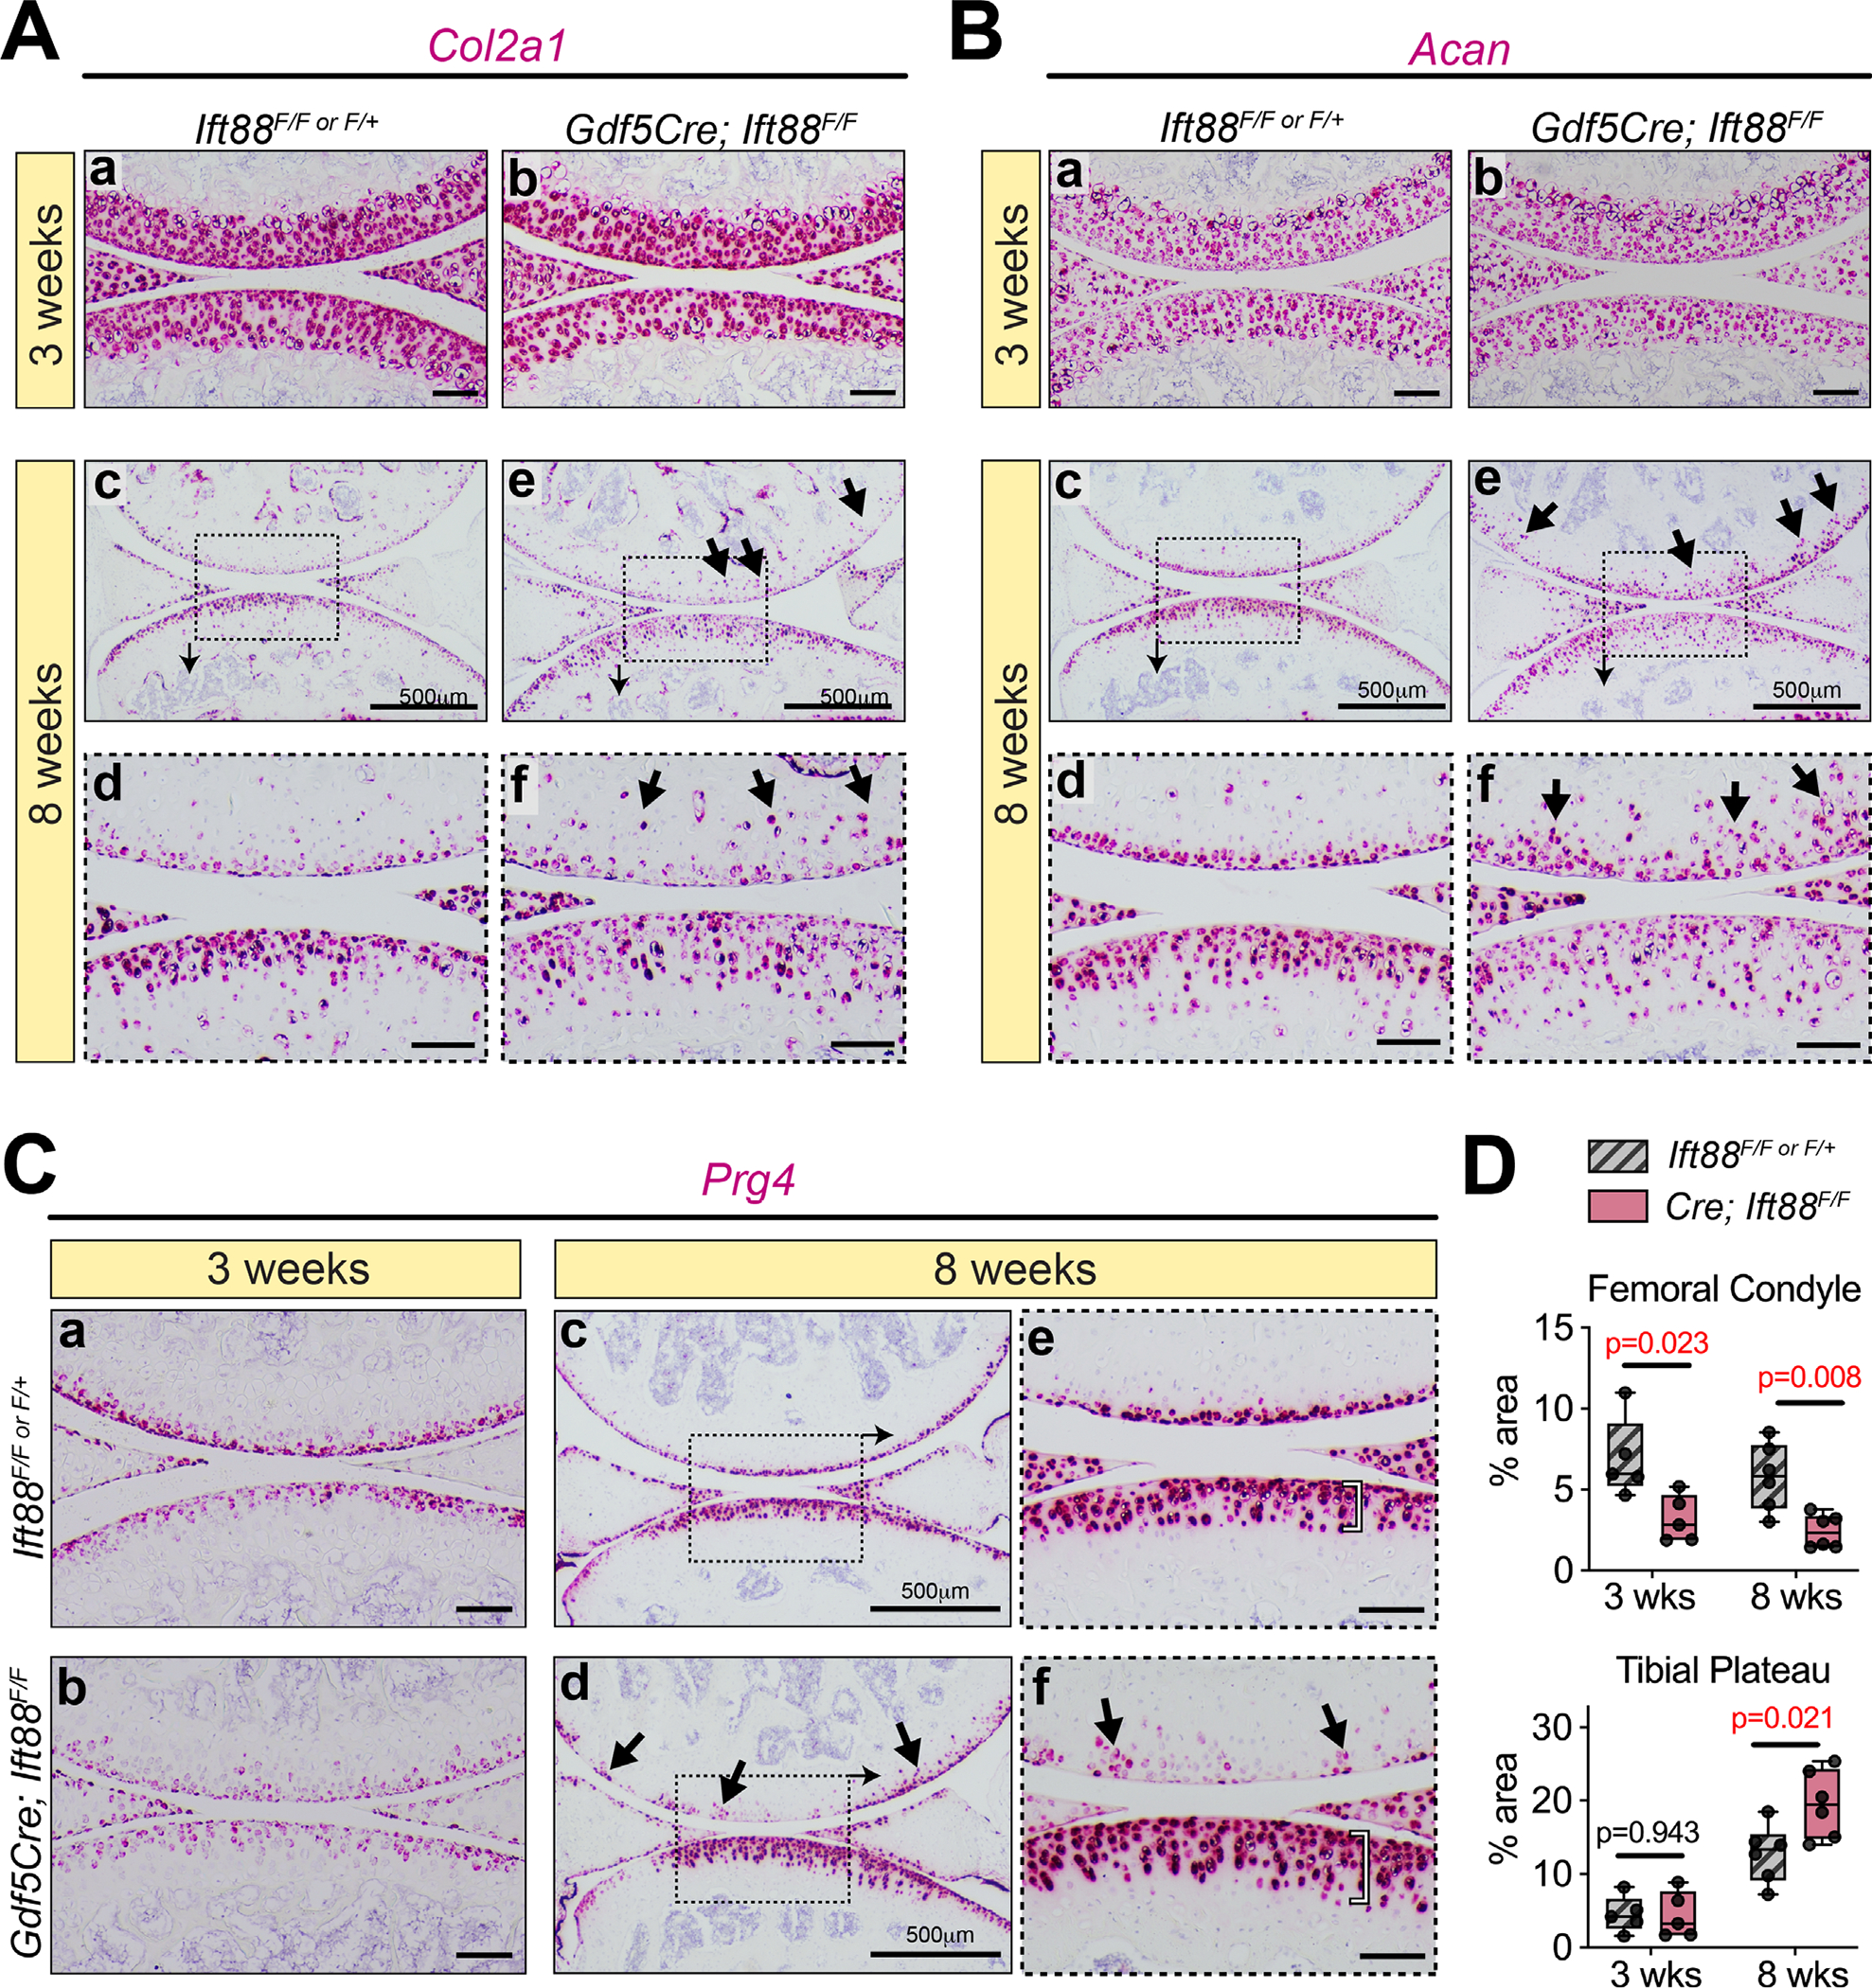
Fig. 5.

Altered ECM in mature mutant AC correlates with abnormal gene expression. (A,B) RNAscope for Col2a1 (A) and Acan (B) is comparable in controls and mutants at 3 weeks (Aa,b, Ba,b). In control AC at 8 weeks, low magnification images (Ac, Bc) and high magnification images (Ad, Bd) show organization and high levels of expression closest to the surface. In mutant AC, low magnification images (Ae, Be) and high magnification images (Af, Bf) show generally disorganized expression that is displayed deeper into the tissue than in controls (arrows) and decreased particularly in the tibial plateau. (C,D) RNAscope for Prg4 is shown with quantification in D. In the femoral condyle, Prg4 is decreased at 3 weeks (Ca,b, top). At 8 weeks, low magnification images (Cc,d, top) and high magnification images (Ce,f, top) show generally decreased but patchy expression (arrows). In the tibial plateau, Prg4 expression is unchanged at 3 weeks (Ca,b, bottom). At 8 weeks, low-magnification images (Cc,d, bottom) and high-magnification images (Ce,f, bottom) show a significant increase of Prg4 that extends further from the surface (bracket). Quantification of Prg4 in D is shown as a percentage area of AC per section after staining area was measured by thresholding the red signal in ImageJ. Statistical analyses performed by unpaired t tests with Welch correction. M (with arrow) denotes regions of mAC in images. Scale bar = 100 μm. All images displayed with FC on top and TP on bottom unless otherwise noted. FC = femoral condyle; TP = tibial plateau; mAC = mineralized articular cartilage; non-mAC = nonmineralized articular cartilage.
