
Figure 6: Examination of MC IL-13 protein expression.
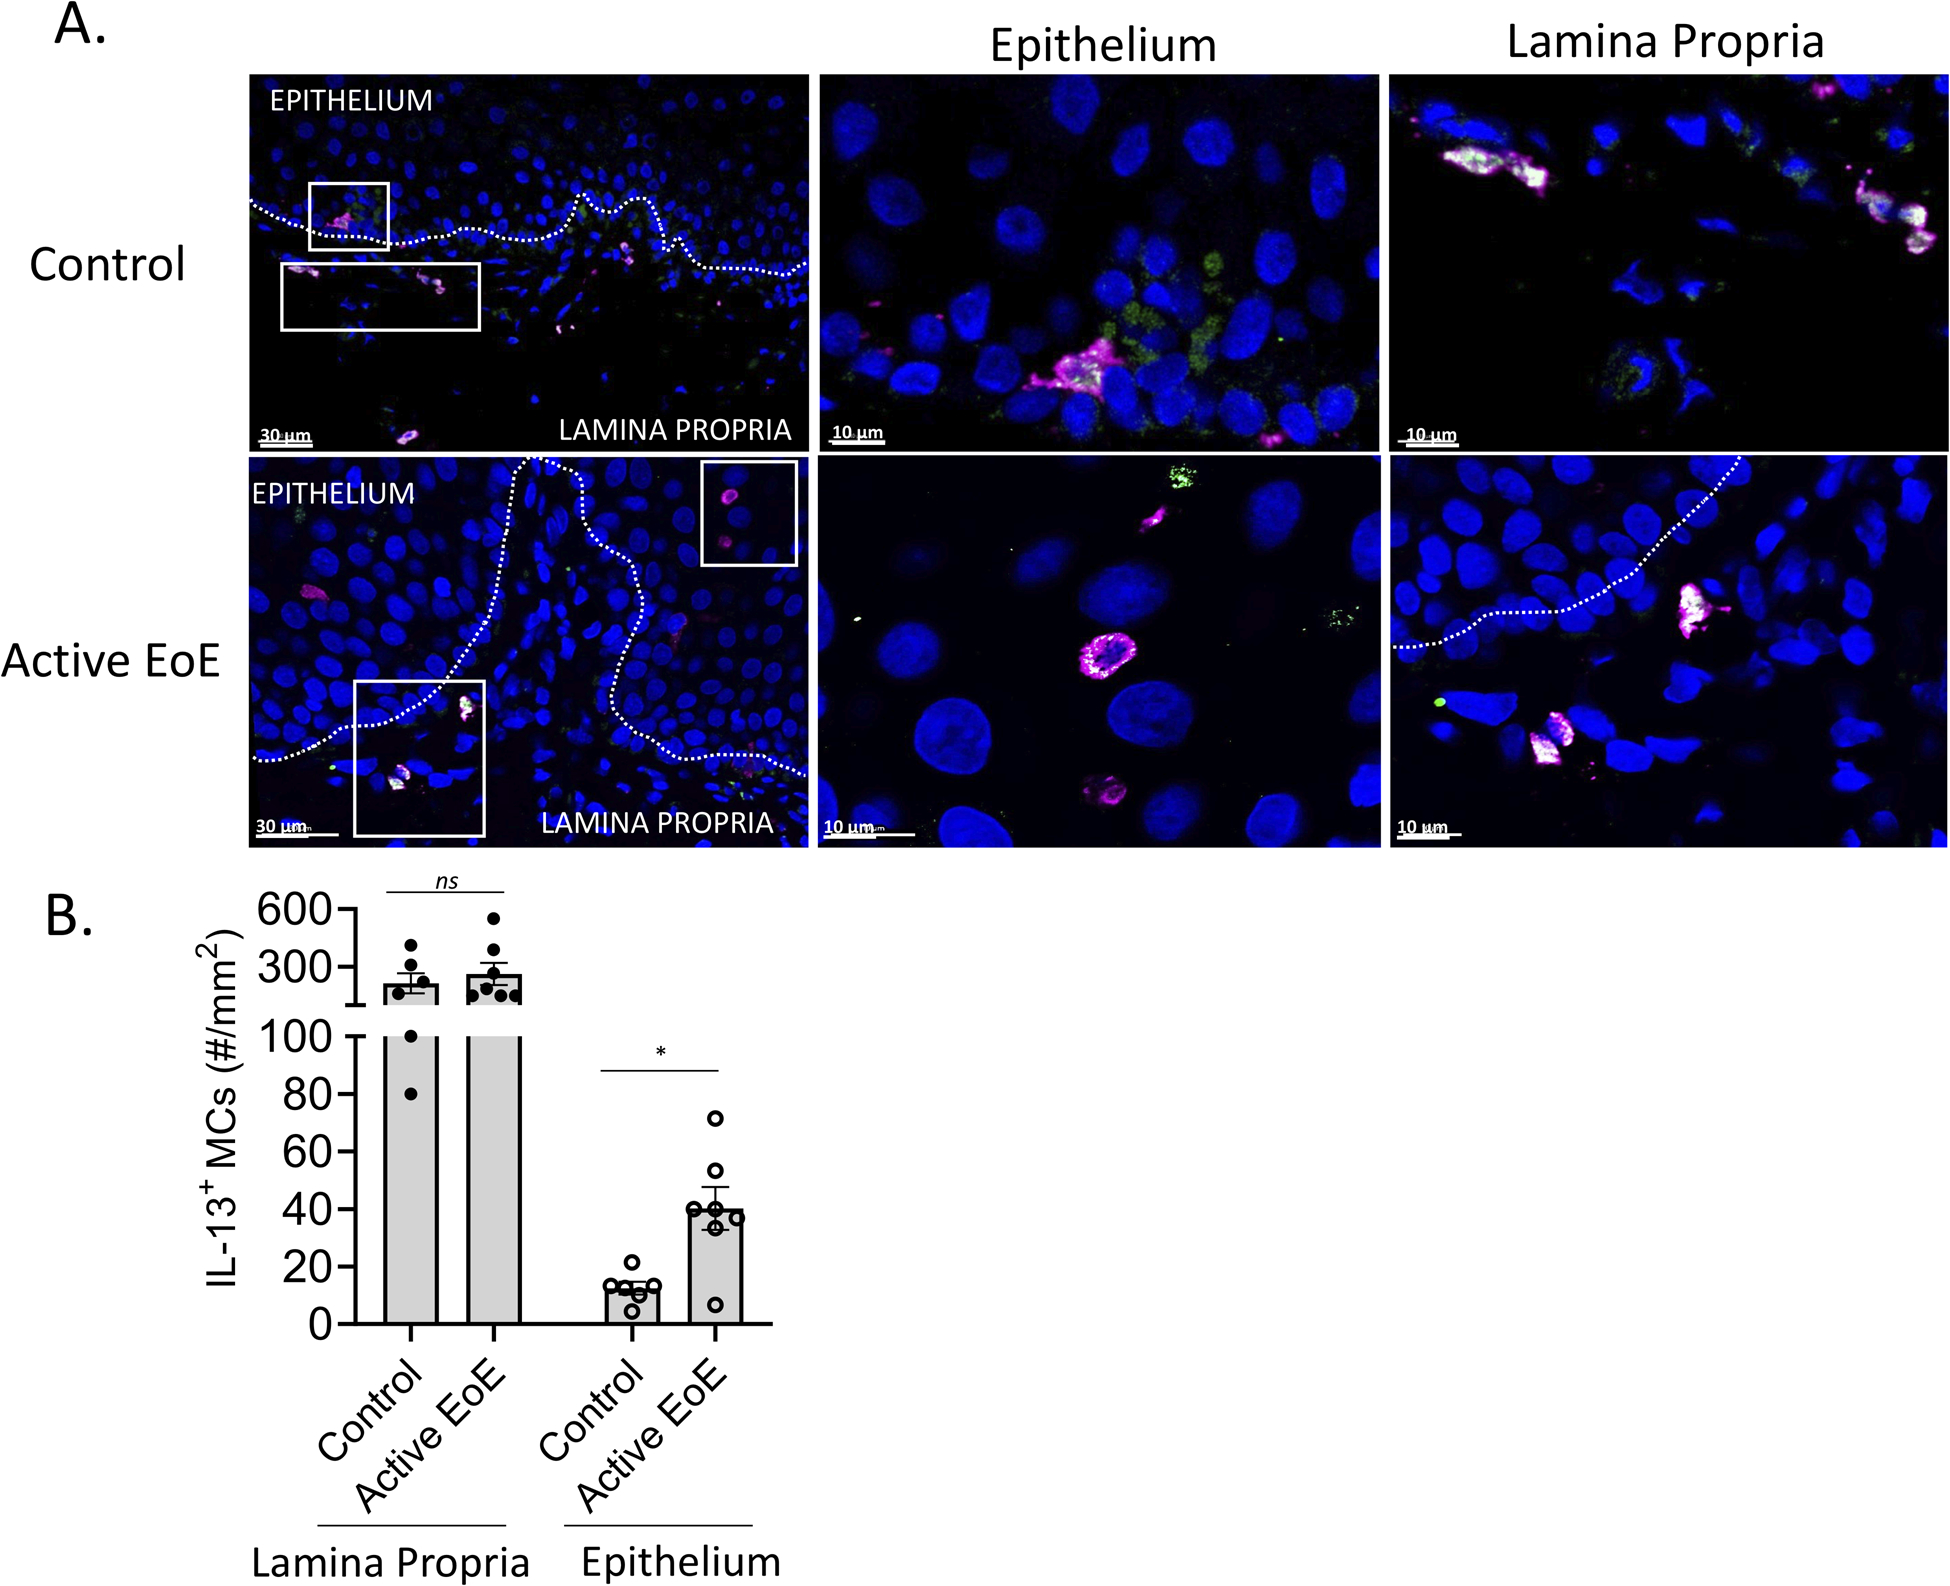
A–B A cohort of esophageal tissue (control, n = 6; active EoE, n = 7) was subject to immunofluorescent staining of tryptase (magenta) as a marker of mast cells (MCs) and IL-13 (green). (A) Representative pictures from control and active EoE are shown in magnification of 20X (left panels) and 40X (epithelium middle panel and lamina propria right panel). Dashed line boxes represent the magnified area in epithelium and lamina propria, respectively. Double positive staining display as a combination of magenta and green, generating white staining. (B) Quantification of IL-13+ MC numbers per mm2 in the lamina propria and epithelial layers. B Bars represent mean ± SEM, which were analyzed using the t-test; *, P < 0.05, ns = not significant.