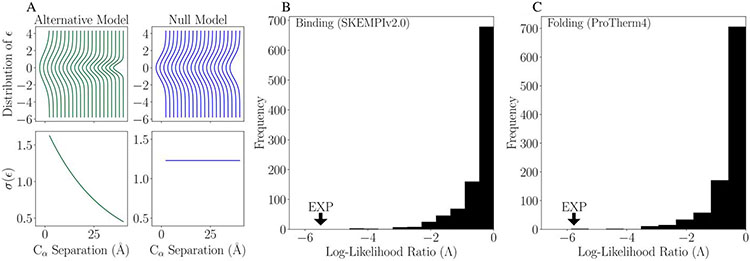
Figure 3:
(A) Comparison between the alternative (left) and null (right) models for epistatic effect, ϵ, as a function of separation distance, r. Results of log(likelihood) ratio test for separation distance with 1000 samples for simulated data for binding affinity (B) and folding stability (C). These plots show the alternative model is a significantly better explanation of the data than the null model.

