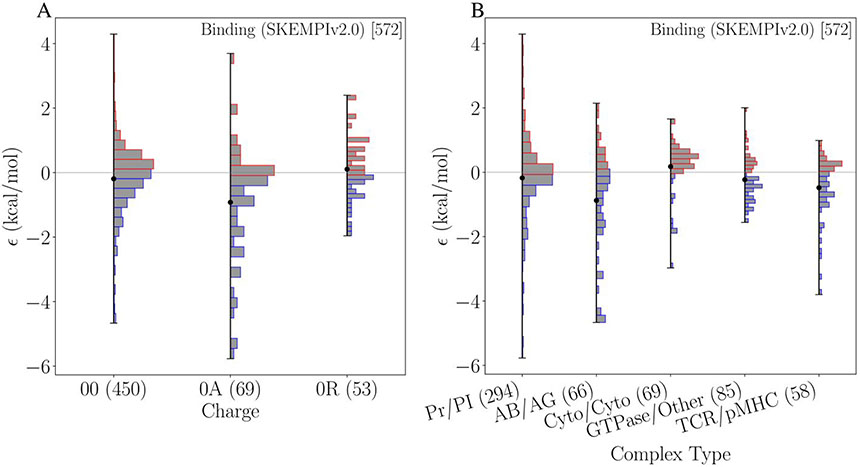
Figure 4:
Comparison of binding model of epistasis for the categories of charge (A) and complex type (B). The mean value for a given subcategory is indicated by a black dot. The barplots show the histograms within the categories. In parenthesis is the number of mutation pairs belonging to each category. For the complex type, the number of complexes belonging to each category are shown in square brackets.

