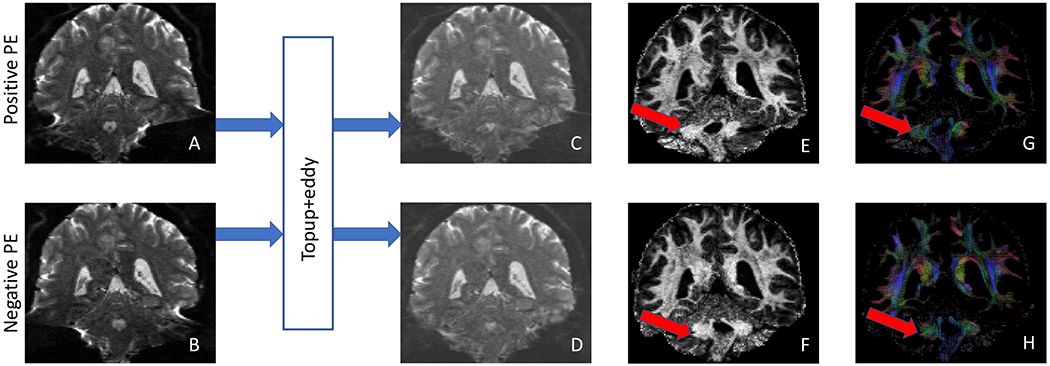
Fig. 1.

Residual distortions in dMRI after correction with topup from HCP data (subject ID: 121416). (A) and (B) are B0 images from two opposite PEs before distortion correction, while (C) and (D) are corresponding B0 images from each PE after distortion correction. (E) and (F) are the first coefficient image of FOD images from two PEs after distortion correction. (G) and (H) are FOD images from two PEs after distortion correction. The red arrows indicate the region with severe residual distortions for each PE after topup correction.
