
Fig. 8.
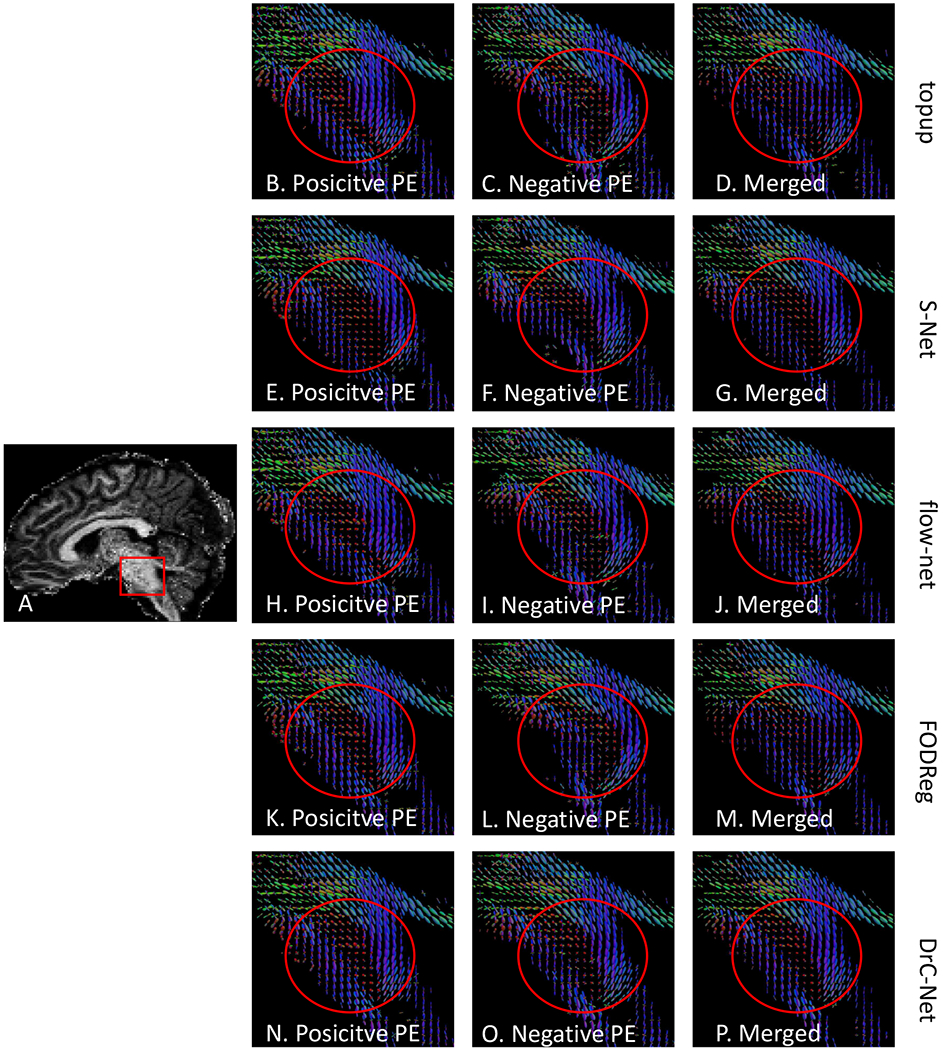
Distortion correction effects shown in FOD images in the brainstem region for subject 1057 in HCLV data. (A) is the sagittal view of the first coefficient image of the FOD image. The five rows are for topup, S–Net, flow–net, FODReg and the proposed method, respectively. (B) (E), (H), (K) and (N) are FODs from the positive PE, while (C), (F), (I), (L) and (O) are FODs from the negative PE. The last column shows FODs from the merged data after correction with different methods.