
Fig. 9.
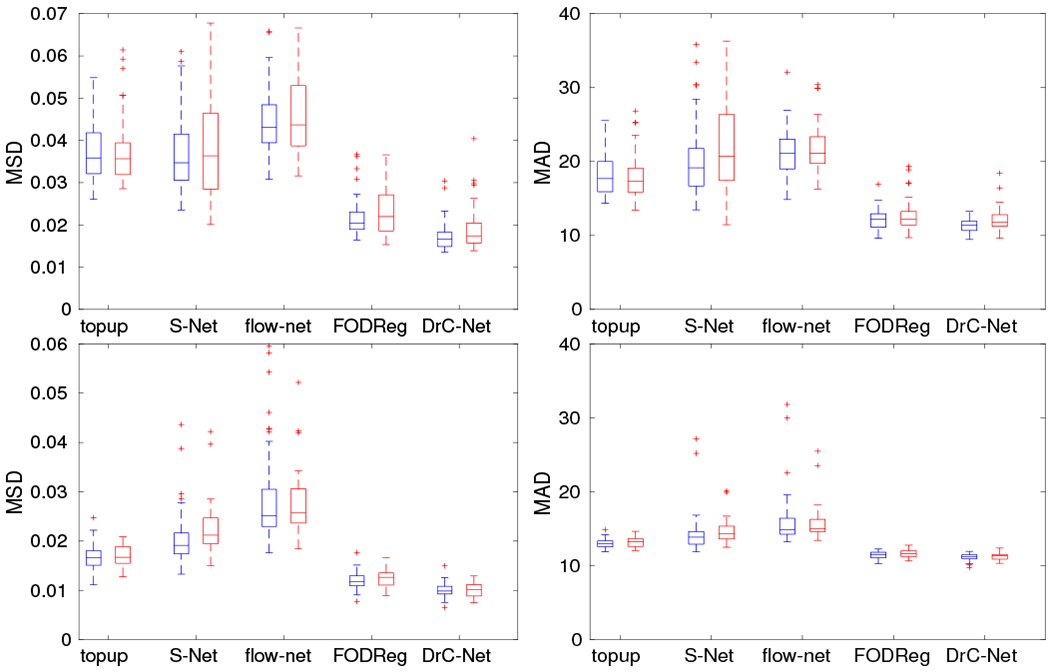
The quantitative results of five methods evaluated on two ROIs for HCP data. The top row is for the pons region and the bottom row is for the whole white matter region. The left column is for the evaluation measure MSD of FA image after correction and the right column is for the angular difference of main fiber direction in FOD image after correction. For all methods, the blue box plot shows results from training data and red box plot shows results from testing data.