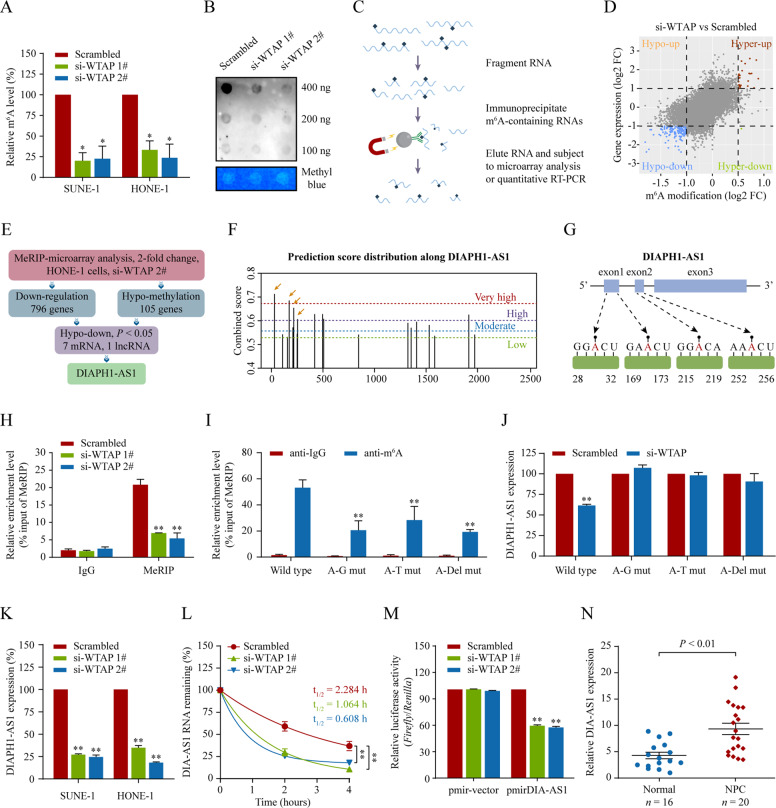
Fig. 4. WTAP-mediated m6A methylation stabilizes lncRNA DIAPH1-AS1.
A, B Total RNA m6A contents in WTAP-knockdown HONE-1 and SUNE-1 cells. Total RNAs were submitted to global m6A levels quantification analysis (A) and dot blot assays (B). C Schematic outline of the MeRIP followed by microarray and qPCR analysis. D MeRIP followed by microarray analysis to identify WTAP-mediated RNA methylation. Distribution of genes with significantly altered m6A levels and expression levels in HONE-1 cells with WTAP knockdown. E The hypomethylated lncRNA DIAPH1-AS1 was identified as downregulated expression in HONE-1 cells with WTAP knockdown. F The enriched and specific m6A peak distribution of DIAPH1-AS1 transcripts predicted by SRAMP. The yellow arrows indicate the m6A enrichment peaks in 1‒281nt of DIAPH1-AS1 transcripts. G Diagram showing the position of m6A motifs with a high combined score within DIAPH1-AS1 transcripts. H m6A enrichment in DIAPH1-AS1 transcripts (1–281 nt) in control and WTAP-silencing cells using MeRIP-qPCR. I MeRIP-qPCR assays to analyze the m6A-modification levels of DIAPH1-AS1 in HONE-1 cells transfected with DIAPH1-AS1 wild type and its mutants expression. A–G mut, adenine residues substituted by guanine; A–T mut, adenine residues substituted by thymine; A–Del mut, adenine residues deleted. J Quantitative RT-PCR for detecting DIAPH1-AS1 expression in HONE-1 cells transfected with DIAPH1-AS1 wild type or mutant constructs together with WTAP siRNAs or its scramble. K Quantitative RT-PCR analysis of DIAPH1-AS1 expression in SUNE-1 and HONE-1 cells with WTAP knockdown. L DIAPH1-AS1 RNA stability in control and WTAP-silenced cells. Quantitative RT-PCR of DIAPH1-AS1 expression at various time points after actinomycin D (10 μg/mL) treatment. M Relative luciferase activity in HONE-1 cells co-transfected with luciferase reporter pmirGLO-DIAPH1-AS1 or its vector pmirGLO (luciferase reporter) and WTAP siRNAs or its scramble control. Data appear as the relative ratio of Firefly to Renilla luciferase activities. N Relative expression of DIAPH1-AS1 in NPC (n = 20) and normal nasopharyngeal epithelial tissues (n = 16) measured by qRT-PCR. Data are presented as the means ± SD. *P < 0.05, **P < 0.01. The experiments were repeated at least three times independently.

