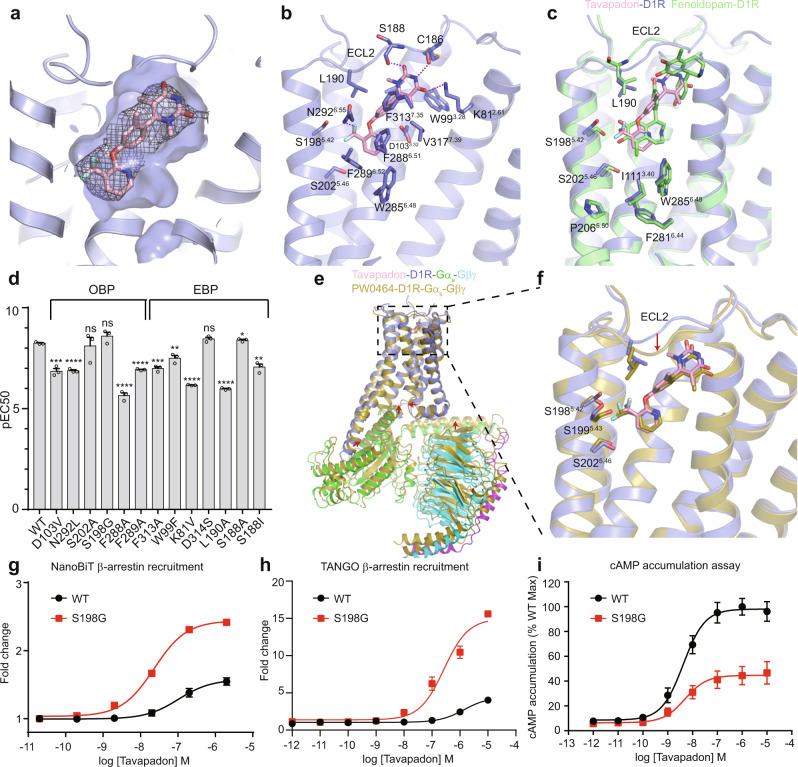
Fig. 3. Non-catechol agonist recognition by D1R.
a Surface view of the tavapadon binding pocket. Tavapadon is shown as sticks, and EM density is shown for tavapadon. b Interactions between tavapadon and the receptor. c Structural comparison between the tavapadon- and fenoldopam-bound D1R. d Effect of D1R mutants on the ability of tavapadon to stimulate the production of cAMP. Three independent experiments were repeated for each construct. Data are presented as mean values ± SEM. p values were calculated by means of two-tailed Student’s t test (*p < 0.05, **p < 0.01, ***p < 0.001, ****p < 0.0001). The exact p values are as follows, D103V, ***p = 0.0005; N292L, ****p = 0.00002; S202A, p = 0.7662; S198G, p = 0.1421; F288A, ****p = 0.000046; F289A, ****p = 0.000006; F313A, ***p = 0.0002; W99F, **p = 0.0055; K81V, ****p = 6.2E-07; D314S, p = 0.0785; L190A, ****p = 9.2E−07; S188A, *p = 0.0477; S188I, **p = 0.0015. e Structural overlay of the tavapadon-bound D1R complex and PW0464-bound D1R complex; the receptors are aligned. f Close-up view of the ligand-binding pocket. Concentration-response curves for D1R WT and the S198G mutant activated by tavapadon measured using the NanoBiT (g) and TANGO (h) β-arrestin recruitment assay and the cAMP accumulation assay (i). Each data point represents mean ± SEM from three independent experiments. Source data are provided as a Source Date file.

