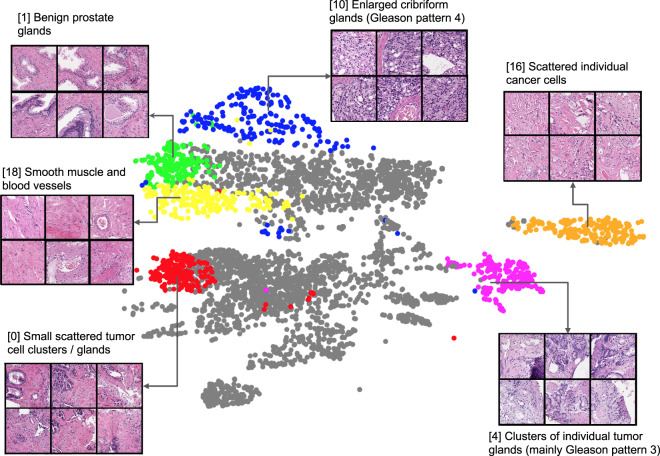
Fig. 2. Pathologist interpretation of self-supervised model tissue clusters.
The self-supervised model in the multimodal model was trained to identify whether or not augmented versions of small patches of tissue came from the same original patch, without ever seeing clinical data labels. After training, each image patch in the dataset of 10.05 M image patches was fed through this model to extract a 128-dimensional feature vector, and the UMAP algorithm27 was used to cluster and visualize the resultant vectors. A pathologist was then asked to interpret the 20 image patches closest to each of the 25 cluster centroids—the descriptions are shown next to the insets. For clarity, we only highlight 6 clusters (colored), and show the remaining clusters in gray. See Supplementary Fig. 2 for full pathologist annotation.

