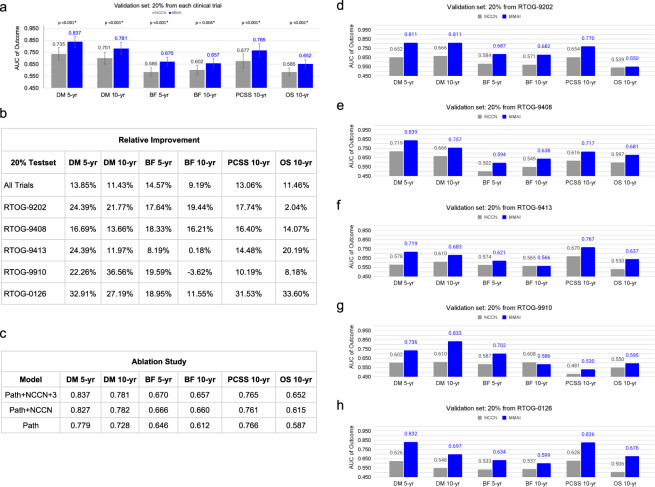
Fig. 3. Comparison of the multimodal deep learning system to NCCN risk groups across trials and outcomes.
a Performance results reporting on the area under the curve (AUC) of time-dependent receiver operator characteristics of the MMAI (blue bars) vs. NCCN (gray bars) models, include 95% confidence intervals and two-sided p-values. Comparisons were made across 5-year and 10-year time points on the following binary outcomes: distant metastasis (DM), biochemical failure (BF), prostate cancer-specific survival (PCSS), and overall survival (OS). b Summary table of the relative improvement of the MMAI model over the NCCN model across the various outcomes and broken down by performance on the data from each trial in the validation set. Relative improvement is given by (AUCMMAI − AUCNCCN)/AUCNCCN. c Ablation study showing model performance when trained on a sequentially decreasing set of data inputs, including the pathology images only (path), pathology images + NCCN variables (path + NCCN), and pathology images + NCCN variables + age + Gleason primary + Gleason secondary (path + NCCN + 3). d–h Performance comparison on the individual clinical trial subsets of the validation set—together, these five comprise the entire validation set shown in (a).

