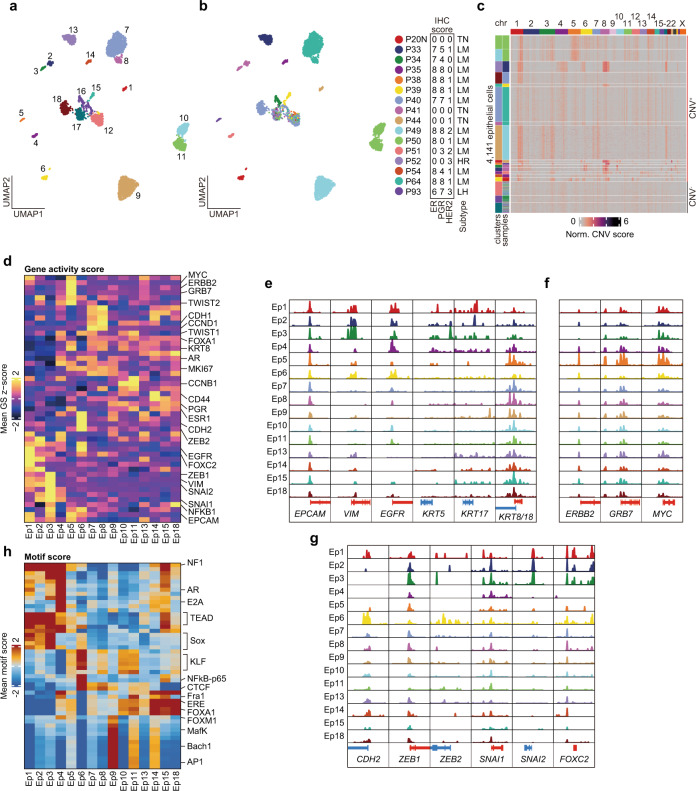
Fig. 2. Chromatin landscape of breast cancer cells.
a, b UMAP of subclustering of 4141 epithelial cells, colored according to corresponding epithelial clusters in a and corresponding patients in b. In a, cluster number is shown on the UMAP. Sample details shown to the right of b are identical to those shown in Fig. 1b. c Inferred copy number variations of 4141 epithelial cells from scATAC-seq data. The log2(fold change) to GC-matched background was calculated and normalized by the same scores for TME cells. Clusters and samples of each cells were represented on the left side of the heatmap. d Heatmap of Z-score of marker gene activity score. e–g Aggregated ATAC signal tracks showing chromatin accessibility peaks of approximate transcription start sites of luminal or TNBC markers in e, HER2 associated genes in f, and epithelial to mesenchymal transition markers in g for each cancer cluster. h Most variable 50 TF motif scores for each cancer cluster.

