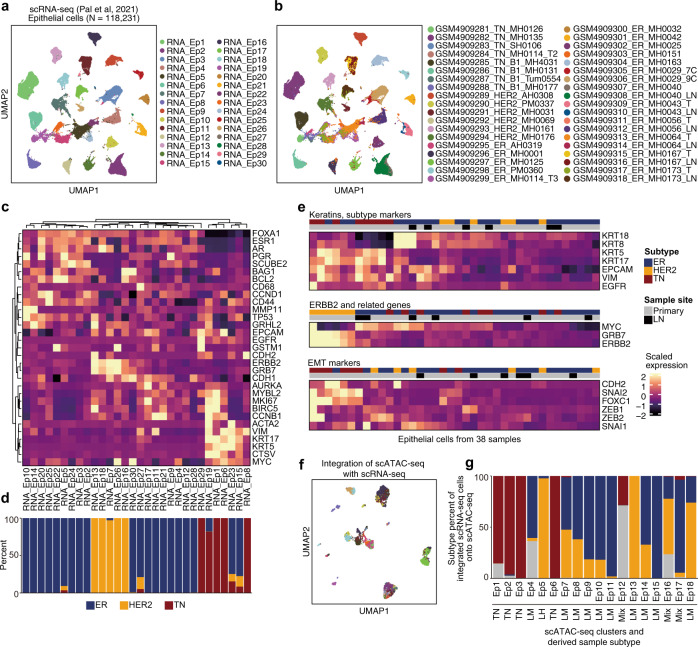
Fig. 3. Integrative analysis of previously reported scRNA-seq results and our scATAC-seq data.
a, b UMAP of subclustering of the epithelial cell transcriptome reported in a previous scRNA-seq study (Pal et al., 2021), colored according to the corresponding epithelial clusters in a and corresponding samples in b. c Heatmap of scaled expression of marker genes. d Breast cancer subtype composition of each epithelial cluster, according to the scRNA-seq. e Heatmap of scaled expression of genes corresponding to the results in Fig. 2e–g. Unlike panel in c, the cells are grouped by sample and average scaled expression is presented. f UMAP visualization of 4,141 epithelial chromatin profiles, colored according to the linked scRNA-seq clusters presented in panel a. Based on gene activity scores, scATAC-seq cells were linked to scRNA-seq exhibiting a similar expression pattern. g Subtype composition of scRNA-seq cells associated with each scATAC-seq cluster.

