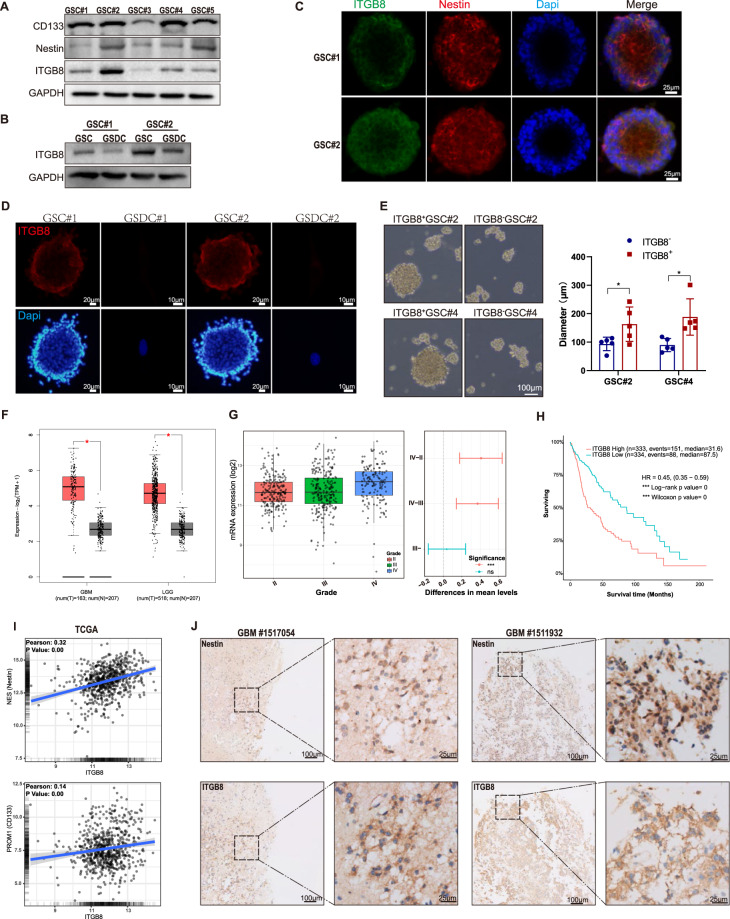
Fig. 1. β8 integrin is enriched in GBM stem cells.
A Levels of indicated proteins in five GBM stem cells derived from human GBM samples were determined via immunoblotting. B Protein levels of ITGB8 in GSCs and corresponding GSDCs were tested via immunoblotting. C Fluorescence staining for ITGB8 and Nestin in GSCs were evaluated. Scale bar = 25 μm. D Fluorescence staining for ITGB8 in GSCs and GSDCs were measured. Scale bar = 10/20 μm. E GSC#2 and GSC#4 fractionated into β8− and β8+ cells, were cultured in serum-free medium to form floating spheres. Measurement of diameters was conducted in five randomly chosen neurospheres in each group. Scale bar = 100 μm. F Gene expression analysis of ITGB8 in GBM, LGG (TCGA) and normal brain tissues (GTEx) was conducted via GEPIA2 web tool. G Gene expression of ITGB8 in TCGA glioma dataset was analyzed based on WHO grade. H Kaplan–Meier analysis for overall survival of glioma patients with high or low ITGB8 expression in TCGA glioma datasets. I Correlation between gene expression of ITGB8 and stem cell markers in TCGA glioma dataset was evaluated. J Representative IHC images of Nestin and ITGB8 in human GBM tissues. Scale bar = 25/100 μm. Uncropped western blot images are shown in Supplementary Fig. 5. Data are expressed as mean ± SD.**p < 0.01, ***p < 0.001. IHC Immunohistochemistry.

