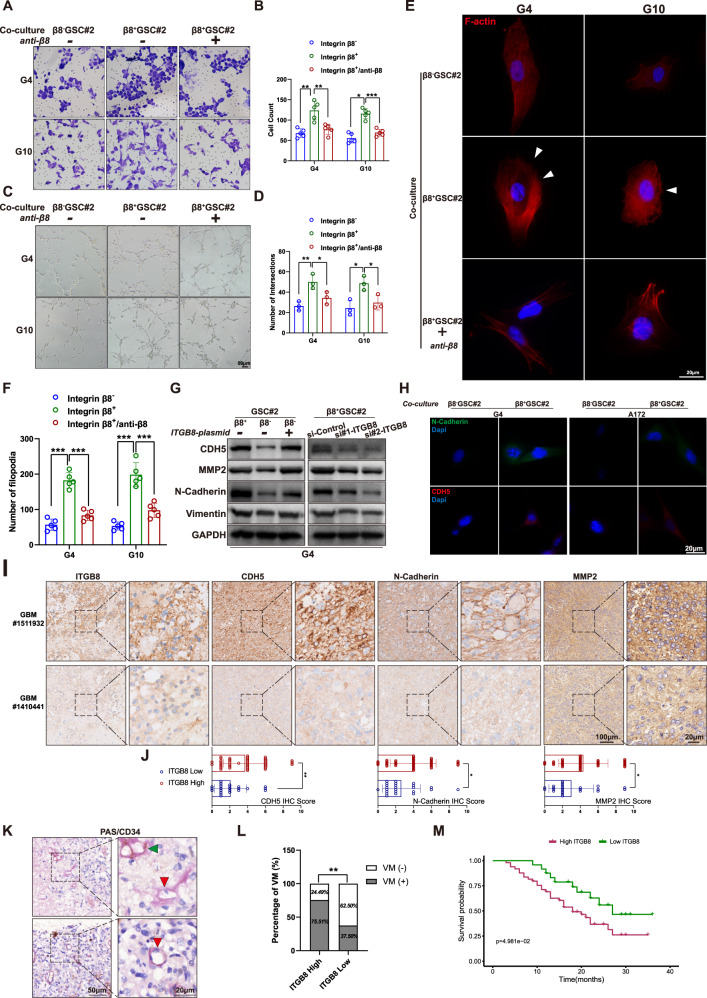
Fig. 4. β8 integrin expressed in GSCs induces elevated network formation and invasive phenotype of GBM cells.
A Primary GBM cells were untreated or pretreated with blocking antibody targeting β8 integrin and co-cultured with β8− or β8+ GSC#2. Migration abilities of GBM cells were determined. B Migrated cells were quantified. C, D Primary GBM cells treated in A were cultured on Matrigel. Network formation capacities of GBM cells were calculated. E Primary GBM cells treated and co-cultured in A, were subjected to immunofluorescence staining with phalloidin. Scale bar = 20 μm. F Filopodia number in E was quantitated and analyzed. G In the left panel, β8+ and β8− GSC#2 were transfected with ITGB8-plasmid or empty vector. In the right panel, β8+ GSC#2 was transfected with scrambled negative control siRNA or siRNA targeting ITGB8. Protein levels of CDH5, MMP2, N-Cadherin and Vimentin were measured. H GBM cells G4 and A172 were co-cultured with β8+ or β8− GSC#2. N-Cadherin and CDH5 expression were determined by immunofluorescence staining. Scale bar = 20 μm. I IHC staining of ITGB8, CDH5, N-Cadherin and MMP2 in representative human GBM sections. Scale bar = 20/100 μm. J Bar charts presenting IHC score of CDH5, N-Cadherin and MMP2 in ITGB8 low or high GBM samples, revealed associations between the expression of ITGB8 and indicated proteins. K VM pattern was identified by PAS/CD34 dual staining. Green arrowhead indicates CD34+ endothelial-based vascular channel, while red arrowhead indicates CD34- VM channel. IHC image in the lower right panel presents a vascular lumen, around which CD34 staining is absent and a deformed nucleus is indicated. L VM pattern quantitation and analysis in human GBM samples with high or low ITGB8 expression. M Kaplan–Meier survival plot of GBM patients with high or low ITGB8 expression. Uncropped western blot images are shown in Supplementary Fig. 5. Results are represented as mean ± SD of biologically triplicate assays. *p < 0.05, **p < 0.01, ***p < 0.001. ns not significant.

