



Abstract
Background:
While the cerebellum is traditionally known for its role in sensorimotor control, emerging research shows that particular subregions, such as right Crus I (RCrusI), support language and social processing. Indeed, cerebellar atypicalities are commonly reported in autism spectrum disorder (ASD), a neurodevelopmental disorder characterized by socio-communicative impairments. However, the cerebellum’s contribution to early socio-communicative development remains virtually unknown.
Methods:
Here, we characterized functional connectivity within cerebro-cerebellar networks implicated in language/social functions in 9-month-old infants who exhibit distinct 3-year socio-communicative developmental profiles. We employed a data-driven clustering approach to stratify our sample of infants at high (n=82) and low (n=37) familial risk for ASD into three cohorts —Delayed, Late-Blooming and Typical— showing unique socio-communicative trajectories. We then compared the cohorts on indices of language and social development. Seed-based functional connectivity analyses with RCrusI were then conducted on infants with fMRI data (n=66). Cohorts were compared on connectivity estimates from a-priori regions, selected on the basis of reported coactivation with RCrusI during language/social tasks.
Results:
The three trajectory-based cohorts broadly differed in social-communication development, as evidenced by robust differences on numerous indices of language and social skills. Importantly, at 9 months, the cohorts showed striking differences in cerebro-cerebellar circuits implicated in language/social functions. For all regions examined, the Delayed cohort exhibited significantly weaker RCrusI connectivity compared to both the Late-Blooming and Typical cohorts, with no significant differences between the latter cohorts.
Conclusions:
We show that hypoconnectivity within distinct cerebro-cerebellar networks in infancy predicts altered socio-communicative development before delays overtly manifest, which may be relevant for early detection and intervention. As the cerebellum is implicated in prediction, our findings point to probabilistic learning as a potential intermediary mechanism that may be disrupted in infancy, cascading into alterations in social communication.
Keywords: autism spectrum disorder, infancy, fMRI, social communication
The cerebellum is traditionally known for its role in sensorimotor control; however, within the last decades, growing evidence has demonstrated that the cerebellum also supports linguistic, cognitive, and social behaviors. Indeed, both anatomical tracing (R. M. Kelly & Strick, 2003; Middleton & Strick, 2001) and human neuroimaging studies (Bernard et al., 2012; Buckner, Krienen, Castellanos, Diaz, & Yeo, 2011; Krienen & Buckner, 2009) show that distinct subregions of the cerebellum are connected with higher-order regions, including prefrontal and posterior parietal cortices. The cerebellum is hypothesized to support these higher-order functions similarly to motor control: by generating internal models –or predictions– and updating these models using sensory feedback (Ito, 2008). Efforts to parcellate the cerebellum by its functions have provided converging evidence that the right posterior cerebellum, including RcrusI, supports language and social processing (E, Chen, Ho, & Desmond, 2014; King, Hernandez-Castillo, Poldrack, Ivry, & Diedrichsen, 2019).
Within the language domain, RcrusI is implicated in a wide range of functions, including encoding verbal information (Chen & Desmond, 2005; Marvel & Desmond, 2012a), generating predictions (D’Mello, Turkeltaub, & Stoodley, 2017; Lesage, Hansen, & Miall, 2017), and forming lexico-semantic associations (Lesage, Nailer, & Miall, 2016), though how it contributes to these diverse functions remains poorly understood (Mariën et al., 2014). Within the social domain, the right posterior cerebellum has been shown to support mentalizing. For instance, it is recruited to interpret social action sequences requiring theory of mind (Heleven, van Dun, & Van Overwalle, 2019) via communication with hubs of the mentalizing network (Van Overwalle, Van de Steen, & Mariën, 2019). A dominant view is that the posterior cerebellum supports social cognition via the generation of internal models of others’ mental states (Van Overwalle et al., 2020).
Interestingly, studies at many levels of analysis have shown cerebellar atypicalities in autism spectrum disorder (ASD), a neurodevelopmental disorder characterized by social communication impairments (D’Mello & Stoodley, 2015; Fatemi et al., 2012). Importantly, structural MRI meta-analyses in ASD have revealed that these cerebellar disruptions are pronounced in RcrusI (DeRamus & Kana, 2015; Stoodley, 2014). At the cellular level, post-mortem brains of individuals with ASD exhibit reductions in Purkinje neurons in Crus I and II (Skefos et al., 2014). At the structural level, ASD youth show grey-matter volume reductions in RcrusI, relative to neurotypical controls (D’Mello, Moore, Crocetti, Mostofsky, & Stoodley, 2016a), with greater reductions in size correlating with increased social communication impairments (D’Mello, Crocetti, Mostofsky, & Stoodley, 2015). Resting-state functional MRI (rsfMRI) studies report that, compared to matched controls, ASD youth exhibit hypoconnectivity between RcrusI and both supramodal and language-related regions (E. Kelly, Meng, et al., 2020; Khan et al., 2015; Lidstone, Rochowiak, Mostofsky, & Nebel, 2021; Verly et al., 2014a). Importantly, studies in mice also show that chemogenic disruptions on RcrusI (Badura et al., 2018; Stoodley et al., 2017), as well as on circuits connecting RcrusI to medial prefrontal cortex (E. Kelly, Meng, et al., 2020), produce deficits in social behavior.
While much evidence has implicated the cerebellum in language and social functions, virtually nothing is known about the establishment of these cerebro-cerebellar circuits in infancy and their contribution to the development of later language and social skills. One way to address this gap is by examining early cerebro-cerebellar connectivity in infants who are at high familial risk (HR) for ASD. These infants often exhibit atypical language and social development, (Gammer et al., 2015; Garrido, Petrova, Watson, Garcia-Retamero, & Carballo, 2017) and importantly, there is considerable variability in symptom severity. For example, many HR infants who do not get an ASD diagnosis show normative receptive and expressive language profiles across the first few years of life (Hudry et al., 2014), as well as social and communication skills similar to low familial risk (LR) infants (Georgiades et al., 2013). Furthermore, while many HR infants who develop ASD exhibit language impairments (Hudry et al., 2010), there is marked heterogeneity in language abilities even among children with ASD (Tager-Flusberg, Paul, & Lord, 2005). Indeed, a recent study which took a novel data-driven approach to stratify HR and LR infants into three distinct groups based on their language development from 6 months to 3 years found that children with ASD were represented in all three groups, albeit to a different degree (Longard et al., 2017). Together, these studies highlight the heterogeneity of language outcomes within HR infants overall, and even within HR infants who develop ASD. Thus, a study which follows HR and LR infants longitudinally, comparing early cerebellar connectivity between cohorts who show distinct language profiles (vs. risk cohorts or cohorts based on diagnostic outcome), is particularly suited for investigating how early disruptions in cerebellar connectivity can cascade into deviations in the developmental unfolding of socio-communicative skills.
Although core behavioral symptoms of ASD, such as impairments in social communication, only begin to manifest during the second year of life, prior studies in HR infants suggest that atypicalities in neural circuits underlying these functions are observable before an infant’s first birthday (Wolff, Jacob, & Elison, 2018). Studies examining functional connectivity (Emerson et al., 2017), structural connectivity (Lewis et al., 2017; Wolff et al., 2017), and brain structure (Hazlett et al., 2017) have all found significant alterations in the first year of life within HR infants who later develop ASD. Recent work has also demonstrated neural disruptions in social and language-related networks that may specifically underlie individual variability in social communication skills. Within HR infants, individual differences in neural activity in response to vocal sounds (Blasi et al., 2015) and speech signals (Liu, Tsang, et al., 2020; Tran et al., 2021) as well as in structural connectivity within language-networks (Liu et al., 2019) are predictive of later social and language abilities. Furthermore, HR infants exhibit altered trajectories in the emergence of functional connectivity within language-related networks across the first year (Liu, Okada, et al., 2020) and local hyperconnectivity within canonical “social brain” networks in the first weeks (Ciarrusta et al., 2019).
With regard to the cerebellum, cerebellar volume in 4–6-month-old HR infants predicted later severity of restricted and repetitive symptoms, though only a trend-level association was found for social atypicalities (Pote et al., 2019). Further, cerebellar white-matter integrity across 6, 12 and 24 months of age was also predictive of severity of restricted, repetitive behaviors and sensory processing atypicalities at 24 months (Wolff et al., 2017). To our knowledge, no study to date has examined the contribution of functional connectivity within cerebro-cerebellar circuits in infancy to social communication development.
To address this gap, we characterized functional connectivity in infancy within cerebro-cerebellar circuits implicated in social/language functions and examined how it may be related to later socio-communicative development. Specifically, we took a similar data-driven approach as Longard and colleagues (2017) to stratify our sample of HR and LR infants into distinct cohorts as a function of their receptive language trajectories from 6 to 36 months of age. We chose receptive language to index overall social communication because language learning is embedded in early social interactions and thus fundamentally constrained by infants’ social skills (Kuhl, 2007). We then used rsfMRI to examine differences between cohorts in the strength of functional connectivity within cerebro-cerebellar circuits at 9 months of age. Given the wealth of evidence implicating RcrusI in both social cognition (E. Kelly, Meng, et al., 2020; Stoodley et al., 2017) and language processing (D’Mello et al., 2017; Verly et al., 2014a), we hypothesized that RcrusI connectivity would be reduced in infants who exhibited delayed socio-communication profiles.
Materials and Methods
Participants
Participants were enrolled in a longitudinal project examining early behavioral and brain-based markers of ASD. Informed consent was obtained from all infants’ parents/legal guardians under protocols approved by the UCLA Institutional Review Board. Infants were assigned to ASD risk cohorts based on family history: HR infants had at least one sibling with a clinical ASD diagnosis, whereas LR infants had no known family history of ASD (i.e., no first- or second-degree relatives with ASD) or any other neurodevelopmental disorders. A final sample of 119 children were included in our analyses. See the Supporting Information for exclusionary criteria.
Behavioral Measures
A battery of behavioral assessments examining social and language development as well as ASD symptomatology was conducted at 6, 9, 12, 18, and 36 months of age by trained examiners in the Child and Adult Neurodevelopmental Clinic at UCLA. The Mullen Scales of Early Learning (MSEL; Mullen, 1995) were administered at 6, 9, 12, 18 and 36 months of age. The MSEL is a normed developmental assessment indexing abilities in several domains; standardized age-normed T-scores from the receptive language subscale were used to index language comprehension abilities in our analyses. The Vocabulary Checklist of the Words and Gestures form of the MacArthur-Bates Communicative Development Inventories (MCDI; Fenson et al., 2007) – a parent-report standardized questionnaire – was also used at 9, 12, and 18 months of age to measure a child’s receptive and expressive vocabulary.
The Early Social Communication Scales (ESCS; Mundy et al., 2003) –a structured, play-based assessment of nonverbal social communication– was administered at 12 and 18 months to measure the rate per minute of initiating joint attention (IJA) and proportion of responding to joint attention (RJA). See the Supporting Information for details on the ESCS.
The Autism Observation Scale for Infants (AOSI; Bryson et al., 2008) was administered at 12 months to assess early signs of ASD; total scores were used in our analyses. The Autism Diagnostic Observation Schedule-Toddler Module (ADOS-T; Luyster et al., 2009) was administered at 18 months to measure ASD symptomatology; scores on the Social Affect subscale were used to index social communication deficits associated with ASD. At 36 months, according to their language level, 79 infants were administered the appropriate module of the Autism Diagnostic Observation Schedule-Second Edition (ADOS-2; Lord et al., 2012); calibrated severity scores (CSS) were analyzed (Gotham, Pickles, & Lord, 2009). At 36 months, 79 participants underwent a clinical assessment to determine outcome classification.
Trajectory-Based Cluster Analysis
Following Longard and colleagues (2017), a data-driven clustering approach was used to stratify infants based on their receptive language trajectories. Receptive language abilities were used to broadly index socio-communicative development, as social and language abilities are difficult to disentangle in early childhood (Kuhl, Coffey-Corina, Padden, & Dawson, 2005; Kuhl, Tsao, & Liu, 2003). Indeed, language learning is thought to be fundamentally driven by the motivation to communicate as well as the ability to harness critical social cues in one’s environments (Kuhl, 2007; Lytle & Kuhl, 2017). MSEL receptive (vs. expressive) language scores were used based on prior evidence that toddlers with ASD exhibit greater impairments in receptive than expressive language abilities (Hudry et al., 2010; R. J. Luyster, Kadlec, Carter, & Tager-Flusberg, 2008). Consistent with previous studies (Landa, Gross, Stuart, & Bauman, 2012; Longard et al., 2017), T-scores were used to stratify infants into distinct cohorts and to conduct pairwise comparisons; raw scores were used for graphical representation of the clustering results (Figure 1) to facilitate visual interpretation of the different developmental trajectories.
Figure 1. Clustering Analysis.
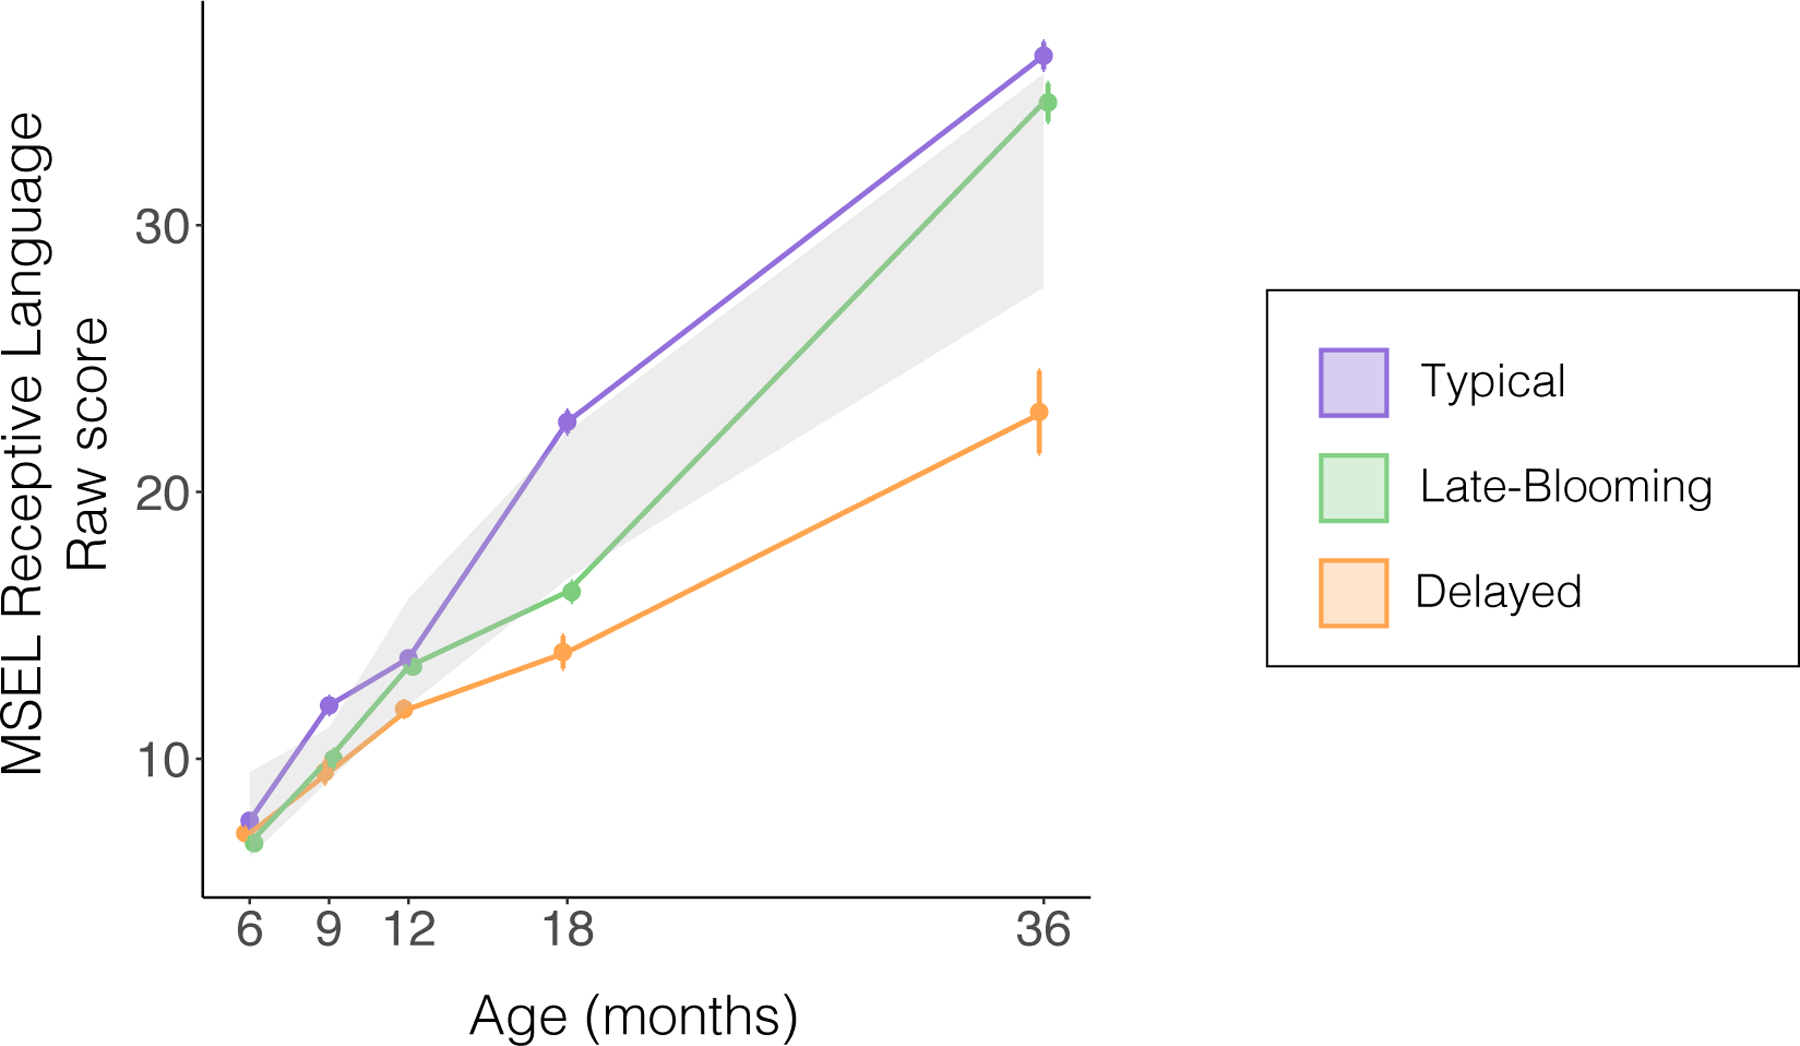
Each cohort’s developmental trajectory of MSEL receptive language raw scores from 6 to 36 months, for visualization purposes. For a reference of normative development, the grey region denotes the range of raw scores corresponding to a T-score range of 40–60 (mean of 50 +/− standard deviation of 10) for each timepoint assessed. This range in T-scores corresponds to the Descriptive Category of “Average”. Error bars indicate standard error of the mean for each cohort. MSEL = Mullen Scales of Early Learning.
A sample of 119 children with MSEL receptive language T-scores beyond the 12-month timepoint were included in these longitudinal cluster analyses, irrespective of whether they contributed imaging data, to maximize power and minimize sampling bias. Longitudinal cluster analyses were conducted using a k-means clustering method for longitudinal data (KmL) via the kml package in R (Genolini, Alacoque, Sentenac, & Arnaud, 2015); see the Supporting Information for additional details about the implementation of these analyses. This clustering method does not require assumptions regarding the shape of the trajectory, can handle missing values, and is just as efficient at clustering longitudinal data (Genolini & Falissard, 2010) as the model-based method (Proc Traj; Jones et al., 2001) employed by Longard and colleagues (2017).
Three distinct cohorts were identified who exhibited divergent trajectories in receptive language development (Figure 1). Specifically, one cohort included infants who consistently exhibited abilities at the advanced end of the normative range (Typical); a second cohort exhibited abilities at the lower end of the normative range from 6 to 18 months, followed by an accelerated gain from 18 to 36 months (Late-Blooming); and a third cohort was characterized by an overall delayed trajectory (Delayed). Table 1 presents demographic information for infants in these three cohorts.
Table 1 –
Demographics
| Full Sample |
Neuroimaging (rsfMRI) Subset |
|||||||
|---|---|---|---|---|---|---|---|---|
| Delayed | Late-Blooming | Typical | P | Delayed | Late-Blooming | Typical | P | |
| Sample Size | 31 | 44 | 44 | 18 | 25 | 23 | ||
|
| ||||||||
| Risk | ||||||||
| High risk | 29 | 32 | 21 | 1.1e-04 | 16 | 18 | 11 | 0.02 |
| Low risk | 2 | 12 | 23 | 2 | 7 | 12 | ||
|
| ||||||||
| Sex | ||||||||
| Female | 8 | 21 | 22 | 0.08 | 3 | 13 | 12 | 0.03 |
| Male | 23 | 23 | 22 | 15 | 12 | 11 | ||
|
| ||||||||
| Maternal Education a | ||||||||
| College and above | 18 | 38 | 40 | 6.5e-05 | 11 | 23 | 22 | 0.001 |
| No College | 12 | 5 | 1 | 7 | 2 | 0 | ||
|
| ||||||||
| MSEL Visual Reception T-scores (12 months) b,c,g | 51.8 +/− 7.85 | 56.75 +/− 8.20 | 57.44 +/− 8.91 | 0.01 | 54.24 +/− 6.04 | 55.76 +/− 7.10 | 58.30 +/− 8.51 | 0.11 |
|
| ||||||||
| ICA Aroma (# Components Kept) g | -- | -- | -- | -- | 37.89 +/− 8.52 | 37.56 +/− 7.81 | 38.74 +/− 8.50 | 0.88 |
|
| ||||||||
| Mean Relative Motion (mm) g | -- | -- | -- | -- | 0.07 +/− 0.04 | 0.06 +/− 0.03 | 0.06 +/− 0.03 | 0.8 |
|
| ||||||||
| Race d | ||||||||
| White | 15 | 26 | 34 | 0.12 | 7 | 16 | 16 | 0.34 |
| Black/African American | 0 | 2 | 0 | 0 | 0 | 0 | ||
| Asian/Pacific Islander | 4 | 4 | 1 | 3 | 3 | 1 | ||
| Multiracial | 8 | 9 | 9 | 5 | 4 | 6 | ||
| Other | 1 | 0 | 0 | 1 | 0 | 0 | ||
|
| ||||||||
| Ethnicity e | ||||||||
| Hispanic or Latine | 14 | 14 | 9 | 0.09 | 7 | 8 | 5 | 0.50 |
| Not Hispanic or Latine | 17 | 30 | 34 | 11 | 17 | 18 | ||
|
| ||||||||
| Outcome Classification f | ||||||||
| Autism Spectrum Disorder | 8 | 6 | 1 | 1e-06 | 5 | 3 | 0 | 9.8e-05 |
| Other | 6 | 2 | 4 | 2 | 0 | 3 | ||
| Typically Developing | 0 | 23 | 29 | 0 | 13 | 17 | ||
Maternal Education: Full Sample - Missing from 1 infant in the Delayed, 1 in the Late-Blooming, and 3 in the Typical cohort. rsfMRI Sample: Missing from 1 infant in the Typical cohort
MSEL Visual Reception T-scores: Full Sample – Missing from 1 infant in the Delayed and 1 in the Typical cohort. rsfMRI Sample: Missing from 1 infant in the Delayed cohort
MSEL Visual Reception is a subscale of the MSEL that is most closely associated with cognitive development
Race: Full Sample - Missing from 3 infants in the Delayed and 3 in the Late-Blooming cohort. rsfMRI Sample - Missing from 2 infants in the Delayed and 2 in the Late-Blooming cohort
Ethnicity: Full Sample - Missing from 1 infant in the Typical cohort.
Outcome Classification: Full Sample - Missing from 17 infants in the Delayed, 13 in the Late-Blooming, and 10 in the Typical cohort. rsfMRI Sample - Missing from 11 infants in the Delayed, 9 in the Late-Blooming, and 3 in the Typical cohorts
Mean +/− SD reported
MSEL=Mullen Scales of Early Learning
rsfMRI = resting-state functional MRI
Cohort Comparisons on Social-Communication Skills
As we aimed to identify cohorts that broadly differed in socio-communicative skills, we first compared cohorts on measures of language development. Specifically, the number of words comprehended and produced, as reported on the MCDI (Fenson et al., 2007) at 9, 12 and 18 months, were analyzed with a Poisson mixed effects model in R (Bates et al., 2020). The model included cohort and testing age as fixed variables and subject ID as a random variable. We evaluated whether developmental trajectories differed by cohort membership, which we statistically modeled as the interaction between testing age and cohort. Then, we performed pairwise comparisons between the three cohorts at each timepoint using the emmeans package in R (Lenth et al., 2020).
We also compared the cohorts on measures of joint attention (i.e., ESCS) and ASD symptomatology (i.e., AOSI, ADOS-T, and ADOS) using R (R Core Team, 2020). We performed statistical comparisons using an Analysis of Variance (ANOVA), Kruskal-Wallis test or Welch’s ANOVA as appropriate, according to the normality of the model residuals and homogeneity of variance. Post-hoc pairwise comparisons between all cohorts were performed using pairwise t-tests or their non-parametric equivalent (Wilcoxon Rank-Sum test) as appropriate. A 5% Benjamini and Hochberg false discovery rate (FDR) was used to correct for multiple comparisons across measures (Benjamini & Hochberg, 1995). Lastly, we performed Chi-square tests to assess differences between cohorts in the proportion of infants with various risk status (i.e., HR, LR) and outcome classification (i.e., ASD, Broader Autism Phenotype, speech-language impairment, other developmental delays in HR infants; ASD, anxiety, behavior problems in LR infants).
Functional MRI Data Acquisition, Preprocessing, and Analysis
Complete information on fMRI acquisition, inclusion criteria, and preprocessing can be found in the Supporting Information.
fMRI Acquisition.
The final imaging sample (Table 1) included 66 infants, 45 HR and 21 LR, with 18, 25 and 23 infants assigned into the Delayed, Late-Blooming, and Typical cohorts, respectively, as per our clustering analysis in the entire sample. At 9 months of age, rsfMRI scans were performed in the evening during natural sleep. MRI data were collected on a Siemens 3T Tim Trio (12-channel head coil) or, following an upgrade to the imaging facilities, on a Prisma scanner (32-channel head coil). The cohorts within the rsfMRI sample were matched on age and motion, but not on maternal education, sex, and familial risk for ASD; accordingly, these variables were covaried for in all fMRI analyses. Although the proportion of infants who underwent MRI with each scanner did not differ by cohort, scanner was also included as a covariate of non-interest in all analyses.
fMRI Preprocessing.
Functional MRI data were preprocessed and analyzed using FMRIB’s Software Library (FSL; Smith et al., 2004). Preprocessing included skull stripping, motion correction, spatial smoothing. fMRI scans were linearly registered to the subject’s corresponding high-resolution anatomical scan, followed by a registration to an infant brain template (Shi et al., 2011). The automatic independent component classifier ICA-AROMA (Pruim et al., 2015) was used to regress out components labeled as motion or noise. Importantly, cohorts did not differ on the number of ICA-AROMA components kept nor on mean relative motion (Table 1). To further reduce noise and other confounds, data were bandpass filtered (0.01 Hz < t < 0.1 Hz); lastly, mean white-matter, cerebrospinal fluid, and global time series (Power et al., 2014) were all included as nuisance regressors at the single-subject level.
fMRI Analysis.
We first parcellated the cerebellum in infant standard space (Shi et al., 2011) by transforming cerebellar subregions from an anatomical map of the human adult cerebellum in MNI space (Diedrichsen, Balsters, Flavell, Cussans, & Ramnani, 2009), using linear transformations performed with FLIRT (affine registration with 7 degrees of freedom).
We then used a hybrid functional/anatomical approach to examine differences in cerebro-cerebellar functional connectivity between the three cohorts. Compared to whole-brain analyses, this approach allowed us to minimize the number of multiple comparisons and thus maximize statistical power given the modest sample size.
The steps involved in our data-analytic pipeline are detailed below and displayed in Figure S1. To create an inclusive map of functional cerebro-cerebellar connectivity from which to extract parameter estimates, we first ran within-group seed-based functional connectivity analyses for each cohort. Based on the literature presented in the Introduction, our primary seed of interest were RcrusI; lobule V, a subregion of the cerebellum specifically subserving sensorimotor functions (Guell, Gabrieli, et al., 2018), was also examined in light of a conceptual framework (Piven et al., 2017) whereby social impairments in ASD may be a downstream manifestation of earlier disruptions in sensorimotor processes (see the Supporting Information for the full rationale behind our seed selection).
For each subject, averaged time series (across all voxels) for each seed were extracted from processed residuals in standard space. Each time series was correlated with that of every other voxel in the brain, and the resulting correlation maps for each seed were then converted into a z-statistic maps using Fisher’s r-to-z transformation. For each cohort, group-level analyses were masked with an anatomical gray matter mask of the whole brain without the cerebellum (Shi et al., 2011). These within-cohort connectivity maps (z>2.3, cluster-corrected at P<0.05) were then summed and binarized to generate an inclusive map of brain regions where any one of the three cohorts showed significant positive connectivity.
From this map, parameter estimates of functional connectivity were extracted, for each seed (RcrusI/bilateral lobule V), from four anatomical ROIs –frontal cortex, supplementary motor area, basal ganglia, and thalamus– as derived from an automated anatomical labeling (AAL) atlas normalized to the UNC neonate template (Shi et al., 2011). The “frontal cortex” ROI included superior frontal gyrus, anterior and middle cingulate, and middle frontal gyrus. The “basal ganglia” ROI included caudate, putamen, and pallidum. These ROIs were selected based on prior evidence of co-activation/connectivity with RcrusI during language processing (D’Mello et al., 2017; Lesage et al., 2017; Verly et al., 2014a) and mentalizing tasks (Van Overwalle & Mariën, 2016), as well as atypical functional connectivity in individuals with ASD (E. Kelly, Meng, et al., 2020; Khan et al., 2015; Verly et al., 2014a).
Cohort Comparisons on Cerebro-Cerebellar Functional Connectivity
To investigate cohort differences in cerebro-cerebellar connectivity, linear models in R (R Core Team, 2020) were used. Scanner, sex, ASD risk status, and maternal education were included as covariates of non-interest in the analyses. A Benjamini and Hochberg false discovery rate (FDR) of 5% was used to correct for multiple comparisons across connectivity measures, with corrected P-values reported (Benjamini & Hochberg, 1995). Plots visualizing parameter estimate differences were created using the ggplot2 package in R (R Core Team, 2020).
Results
Clustering Results
The three cohorts differed in receptive language T-scores at most timepoints assessed. Specifically, the Typical cohort exhibited higher receptive language T-scores compared to both Late-Blooming and Delayed cohorts at all timepoints, whereas the Late-Blooming cohort exhibited greater language abilities compared to the Delayed cohort at 12, 18, and 36 months, but not at 6 or 9 months of age. See Table S1 for a full summary of T-scores and pairwise comparisons between cohorts at each timepoint.
Cohort Comparisons on Social-Communication Skills (Full Sample)
Parent-Reported Vocabulary Measures.
To examine whether differences between cohorts extended to other measures of social-communication, we first compared the three cohorts on measures of both receptive (number of words comprehended) and expressive (words produced) vocabulary, as indexed by the MCDI. Trajectories of both receptive (χ2(2)=275.08, P<0.0001; Figure 2A) and expressive (χ2(2)=24.66, P<0.0001; Figure 2B) vocabulary growth differed between the cohorts, as revealed by an interaction between age at testing and cohort status. Specifically, compared to infants in the Delayed cohort, those in both the Late-Blooming and Typical cohorts exhibited larger increases in both receptive and expressive vocabulary growth from 9 to 18 months of age. Infants in the Typical cohort showed greater age-related increases compared to the Late-Blooming cohort for receptive vocabulary, but no differences were observed in their trajectories of expressive vocabulary growth. Descriptive statistics on pairwise differences in trajectories between cohorts are reported in Table S2. Post-hoc comparisons between the cohorts at each timepoint revealed that infants in the Typical cohort exhibited larger receptive and expressive vocabularies compared to those in the Late-Blooming and Delayed cohorts at all timepoints assessed, whereas the latter two cohorts only showed differences in receptive vocabulary at 18 months and in expressive vocabulary at the 12 and 18 months (Table S3).
Figure 2. Cohort Comparisons of Social-Communication Skills.

(A) The cohorts differ on trajectories from 9–18 months of MCDI receptive vocabulary and (B) expressive vocabulary. (C) The cohorts differ on proportion of responding to joint attention at both 12 and (D) 18 months. (E) The cohorts also differ on ASD symptomatology at 12 months, (F) 18 months, and (G) 36 months. Error bars indicate standard error of the mean. Pairwise comparison between cohorts: † P<0.1; * P<0.05; ** P<0.01; *** P<0.001; **** P<0.0001. Pairwise simple slope comparison between cohorts: ++++ P<0.0001. All p-values reported are FDR corrected across measures. ADOS-T = Autism Diagnostic Observation Schedule-Toddler Module; ADOS-2 = Autism Diagnostic Observation Schedule-Second Edition; AOSI = Autism Observation Scale for Infants; ESCS = Early Social Communication Scales; MCDI = MacArthur-Bates Communicative Development Inventories
Joint Attention.
Joint attention was assessed using the ESCS. The three cohorts differed in their proportion of responses to joint attention, at 12 (F(2, 51.81)=19.79, P<0.0001; Figure 2C) and 18 months (χ2(2,68)=28.00, P<0.0001; Figure 2D). Specifically, at both 12 and 18 months, the Typical cohort displayed greater responses to joint attention compared to both Late-Blooming (12 months: t(66.73)=2.78, P=0.02; 18 months: W=175.5, P=0.01) and Delayed cohorts (12 months: t(47.23)=6.31, P<0.0001; 18 months: W=33.5, p<0.0001), with the Late-Blooming cohort also exhibiting greater responses compared to the Delayed cohort (12 months: t(47.51)=2.92, P=0.01; 18 months: W=58, P<0.001). No between-group differences were found in the ability to spontaneously initiate joint attention at either 12 (χ2(2,86)=0.92, P=0.63) or 18 months (χ2(2,69)=0.99, P=0.61).
ASD Symptomatology.
We also compared the three cohorts on ASD symptomatology. At 12 months, the cohorts differed on the number of ASD risk markers assessed via the AOSI (χ2(2,114)=13.47, P=0.002; Figure 2E). The Typical cohort exhibited fewer ASD risk markers than the Late-Blooming (W=1141.5, P=0.03) and Delayed cohorts (W=904.5, P=0.001); the Delayed cohort exhibited more ASD risk markers than the Late-Blooming cohort, although this difference was not statistically significant (W=807, P=0.09). At 18 months, the cohorts differed on ASD-related social symptoms, based on the Social Affect subscale of the ADOS-T (F(2, 36.31)=11.14, P<0.001; Figure 2F). Specifically, the Typical cohort showed fewer social-communication deficits than both the Late-Blooming (t(55.33)=-2.80, P=0.02) and Delayed cohorts (t(20.39)=-4.34, P<0.001), with the Late-Blooming cohort also exhibiting fewer impairments than the Delayed cohort (t(24.23)=-2.58, P=0.02). Lastly, at 36 months, the cohorts differed on ASD symptomatology, as indexed by ADOS calibrated severity scores (χ2(2,79)=10.54, P=0.007; Figure 2G). Compared to the Delayed cohort, both the Typical (W=366, P=0.004) and Late-Blooming cohorts (W=329, P=0.01) displayed fewer ASD symptoms; the latter two cohorts did not differ (W=589, P=0.53).
Distribution of ASD Risk Status and Outcome Classification Within Cohorts
A Chi-square analysis indicated a significant association between membership in a cohort and ASD risk status and outcome classification (χ2(10, 79)=51.6; P<0.0001; Figure 3). Specifically, HR infants who received an ASD diagnosis or other outcome classification (i.e., Broader Autism Phenotype, speech-language impairment, other developmental delays), as well as LR infants with an ASD diagnosis, were overly represented in the Delayed cohort, whereas typically-developing HR infants were evenly split between the Late-Blooming and Typical cohorts. Typically-developing LR infants and LR infants with other outcome classifications (i.e., anxiety, behavioral problems) were more likely to be assigned to the Typical cohort. See Figure 4 for summary of the percentage of infants in each cohort as a function of ASD risk status * outcome classification.
Figure 3. Cohort Membership by ASD Risk Status and Outcome Classification.
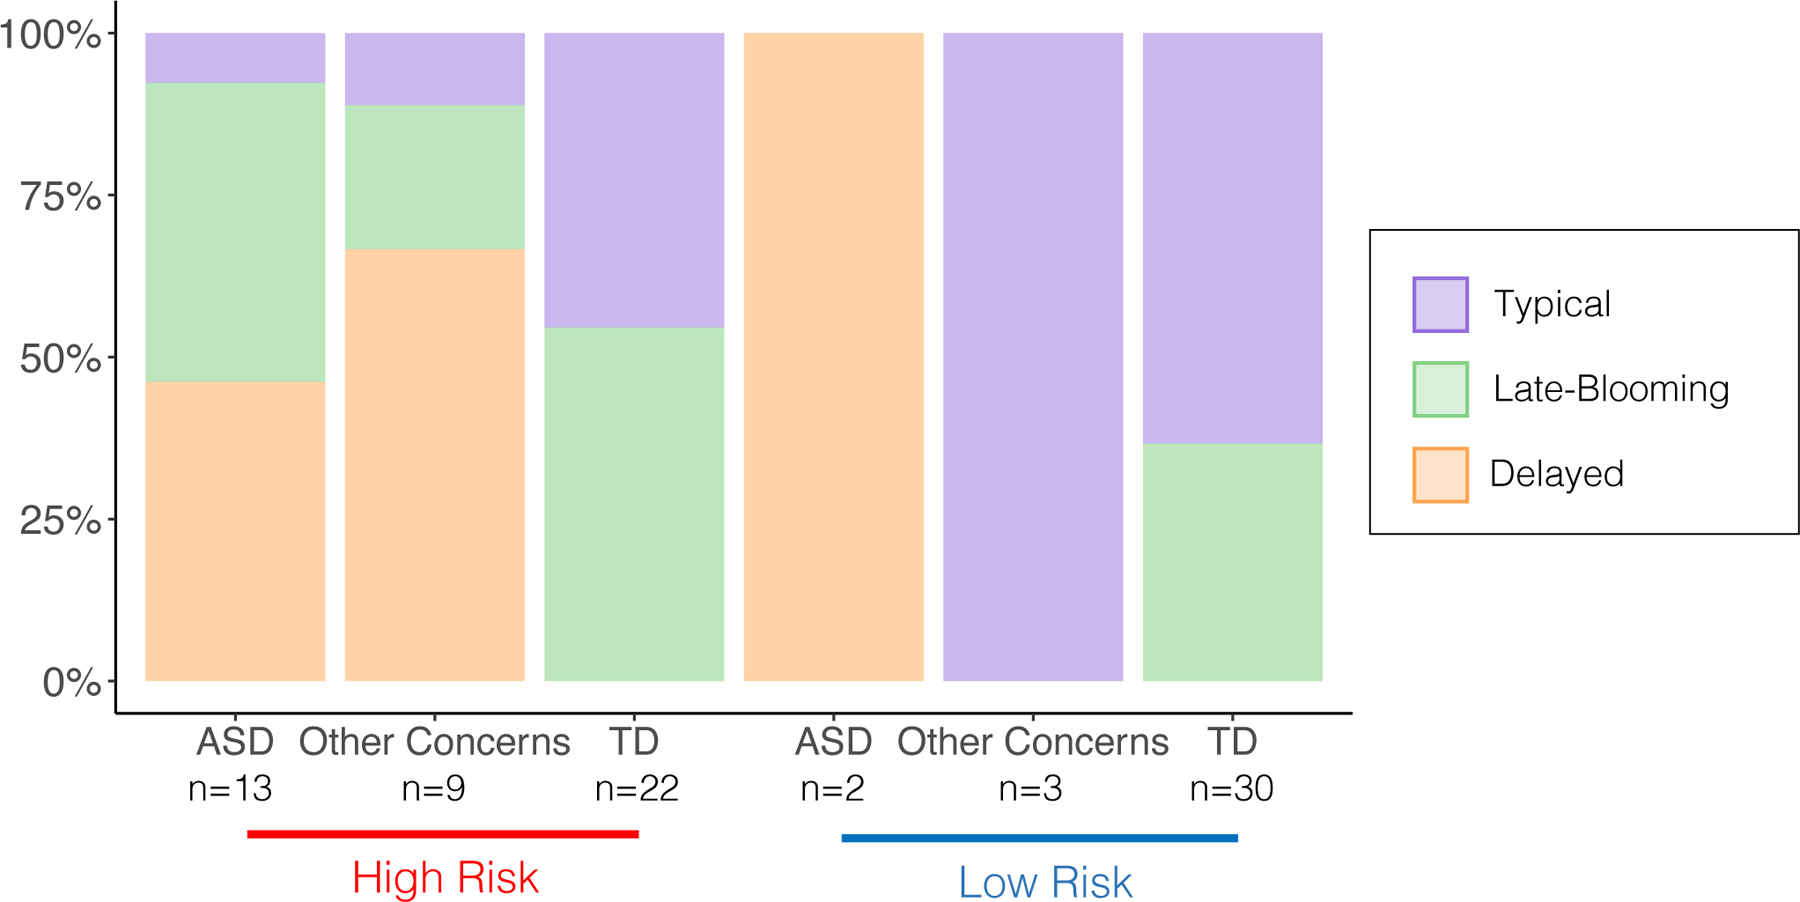
Distribution of infants in each of the cohorts as a function of both their ASD risk status and outcome classification. A Chi-square analysis indicated a significant association between ASD risk * 36-month outcome classification and membership in a cohort (χ2(10, 79)=51.6; P<0.0001). Other Concerns for HR infants include Broader Autism Phenotype, speech-language impairment, and other developmental delays. Other Concerns for LR infants include anxiety and behavior problems. ASD = autism spectrum disorder; HR = high familial risk; LR = low familial risk; TD = typically developing.
Figure 4. Cerebro-Cerebellar Functional Connectivity with Right Crus I.

(A) Group differences in functional connectivity of right Crus I with frontal cortex, (B) supplementary motor area, (C) basal ganglia and (D) thalamus. Error bars indicate standard error of the mean. Results demonstrated that the Delayed cohort exhibits significantly weaker right Crus I connectivity compared to both the Late-Blooming and Typical cohort, with no statistically significant differences between the latter two cohorts. Pairwise comparison between cohorts: * P<0.05, ** P<0.01. All p-values reported are FDR corrected across connectivity measures.
Neuroimaging Sample: Language Development, Joint Attention and ASD Symptomatology
We conducted an identical set of analyses on 66 infants who were included in the neuroimaging analyses (rsfMRI sample). These analyses confirmed that the cohorts in this smaller sample showed similar differences in language development, joint attention and ASD symptomatology. See the Supporting Information for full results on the rsfMRI sample (Figures S2–S3; Tables S4–S5).
Cohort Comparisons on Cerebro-Cerebellar Connectivity
Critically, the cohorts exhibited robust differences in connectivity between RcrusI and all ROIs examined: frontal cortex (F(2,55)=3.42, P=0.05; Figure 4A), supplementary motor area (F(2,55)=3.53, P=0.05; Figure 4B), basal ganglia (F(2,56)=7.07, P=0.007; Figure 4C) and thalamus (F(2,57)=3.14, P=0.05; Figure 4D). The pattern of between-group differences was identical for all ROIs. Specifically, both Typical and Late-Blooming cohorts exhibited stronger cerebro-cerebellar connectivity compared to the Delayed cohort, with no statistically significant differences between the Typical and Late-Blooming cohorts. See Table S6 for post-hoc pairwise comparisons between cohorts for all ROIs.
In contrast to RcrusI, infants in the three cohorts did not exhibit statistically significant differences in connectivity between lobule V and frontal cortices (F(2,58)=0.44, P=0.75), supplementary motor area (F(2,57)=0.75, P=0.75), basal ganglia (F(2,54)=0.70, P=0.75) and thalamus (F(2,58)=0.29, P=0.75).
Additional Post-hoc Analyses
Several additional post-hoc analyses were conducted to (1) examine whether our results of atypical RcrusI connectivity specifically related to socio-communicative deficits vs. other core ASD symptomatology such as RRB (Figure S4), (2) assess the extent to which our connectivity analyses based on data-driven stratification of our sample into three cohorts yielded improved specificity over group comparisons based on familial risk for ASD (Table S7), (3) investigate RcrusI connectivity with cortical regions other than our a-priori ROIs (Figure S5), and (4) explore whether individual differences in RcrusI connectivity correlated with later language and ASD measures. These results are described in the Supporting Information
Discussion
In this study, we examined how early cerebro-cerebellar functional connectivity within networks implicated in social and language functions predict distinct socio-communicative developmental profiles. Three unique trajectories of receptive language development –Delayed, Late-Blooming and Typical– were identified in our sample of infants at high and low familial risk for ASD. Importantly, infants in these trajectory-based cohorts also exhibited robust differences on several additional measures of language abilities, as well as on measures of social engagement and ASD symptomatology, corroborating the notion that early language acquisition may be “gated” by social skills (Kuhl, 2007). Consistent with prior reports (Brian et al., 2014; Longard et al., 2017), these cohorts differed in the proportion of infants with various risk status and outcome classification, mirroring findings in a much larger sample (Longard et al., 2017). Importantly, our neuroimaging analyses demonstrated that, at 9 months of age, infants in these three cohorts showed striking differences in functional connectivity strength within cerebro-cerebellar circuits implicated in language and social functions. Specifically, the Delayed cohort exhibited significantly weaker RcrusI connectivity compared to both the Late-Blooming and Typical cohorts, with no significant differences between the latter two cohorts.
Our functional connectivity analyses at 9 months focused on connectivity between RcrusI and a-priori ROIs: frontal cortex, supplementary motor area, basal ganglia, and thalamus. These ROIs were selected because they show coactivation with RcrusI during social mentalizing (Van Overwalle & Mariën, 2016) and language processing (D’Mello et al., 2017; Lesage et al., 2017; Verly et al., 2014b), as well as on the basis of observed functional connectivity with RcrusI in neurotypical adults (Bernard et al., 2012; Buckner et al., 2011). Notably, we found significantly weaker RcrusI connectivity in the Delayed cohort compared to Late-Blooming and Typical cohorts for all ROIs. Our results converge with those in older individuals with ASD, whereby hypoconnectivity was observed in cerebro-cerebellar networks involving RcrusI and these same ROIs (E. Kelly, Meng, et al., 2020; Khan et al., 2015; Lidstone et al., 2021; Verly et al., 2014b). Furthermore, our results showing disruptions in cerebellar connectivity as early as 9 months of age –well before social or language impairments overtly manifest in a child– highlight the potential clinical relevance of our findings for early detection and intervention. Importantly, we find that cerebellar connectivity differs between infants who continue to show delays in social communication and those who “catch up” to the normative ability from 18 to 36 months. Indexing cerebellar connectivity could help identify infants at greatest risk for sustained delays in social communication.
Results from animal studies provide mechanistic insights into how disruptions in connectivity between RcrusI and frontal cortex may lead to aberrant social behavior. The cerebellum is a key source of inhibitory tone for frontal brain regions –polysynaptic projections from the cerebellum to the frontal cortex are well-documented (Kelly & Strick, 2003; Middleton & Strick, 2001; Strick, Dum, & Fiez, 2009)– with inhibitory signals to the cortex driven by Purkinje neurons (Kelly, Escamilla, & Tsai, 2020). Inhibitory Purkinje neuron loss in the cerebellum is commonly reported in ASD, suggesting that their function may be particularly critical for social behavior (Fatemi et al., 2012; Skefos et al., 2014). Indeed, inhibition of Purkinje neurons in RcrusI in mouse models of ASD causes impairments in social behavior by disinhibiting the medial prefrontal cortex (Kelly, Meng, et al., 2020). Together, these data raise the possibility that our findings of disrupted functional connectivity between RcrusI and frontal cortex in infants who exhibit delayed socio-communicative profiles may reflect a lack of inhibition from RcrusI to frontal cortex. This would be consistent with the hypothesis that altered cortical excitation/inhibition balance contributes to the ASD phenotype (Lee, Lee, & Kim, 2017; Rubenstein & Merzenich, 2003), and suggests that the cerebellum may provide a source of cortical inhibition to regulate excitation/inhibition balance and thus support social functions.
We also observed hypoconnectivity between RcrusI and basal ganglia in infants who later exhibited delayed social communication trajectories. Anatomical tracing studies have identified dense reciprocal connections between the basal ganglia and cerebellum (Bostan, Dum, & Strick, 2010; Hoshi, Tremblay, Féger, Carras, & Strick, 2005). Functionally, an integrated network involving the posterior cerebellum, dorsomedial striatum, and dorsolateral prefrontal cortex (Fermin et al., 2016) supports model-based learning (i.e., learning when an internal model of the environment is available for predicting future outcomes). As effective social communication is predicated on constructing and updating models of other’s mental states (Tamir & Thornton, 2018), our findings of disrupted RcrusI - basal ganglia connectivity in children with socio-communicative impairments suggest that difficulties with social learning may reflect a lack of early integration between nodes of this model-based learning network. Additionally, we also report hypoconnectivity between RcrusI and thalamus in the infant cohort exhibiting atypical socio-communicative development. This is in line with previous findings showing that compared to neurotypical individuals, individuals with ASD exhibit reduced structural integrity of cortico-thalamic-cerebellar tracts responsible for cerebellar output (Catani et al., 2008). Lastly, we report hypoconnectivity between RcrusI and supplementary motor area in infants who later display socio-communicative deficits, consistent with reports of hypoconnectivity between these regions in older individuals with ASD (Lidstone et al., 2021; Verly et al., 2014b). The supplementary motor area is both structurally (Akkal, Dum, & Strick, 2007) and functionally (Bernard et al., 2012) connected to the cerebellum; these connections are thought to support both speech perception and production by facilitating the integration of auditory and temporal sequence processing (Kotz & Schwartze, 2010). Thus, early disruptions in these circuits may negatively impact language learning and behaviorally manifest as language delays.
Our findings raise the important question: how is the establishment of RcrusI connectivity in infancy related to the later acquisition of complex socio-communicative skills? One potential mechanism relates to the cerebellum’s role in prediction. In motor control, the cerebellum is thought to generate an internal model of predicted outcomes based on sensorimotor input from the cortex. Any mismatch between true and predicted outcomes results in error signals, which are used by the cerebellum to make rapid adjustments to the model and optimize future predictions (Ito, 2008; Kelly, Escamilla, et al., 2020; Sokolov, Miall, & Ivry, 2017). Given the relative uniformity of the cellular and computational architecture of the cerebellum, this internal model framework has also been applied to understand the cerebellum’s contribution to social cognition and language (Ramnani, 2006). Social interactions require a high level of prediction –one must generate an internal model of another individual’s mental state, mood and traits based on highly variable social context and then use this to make predictions on the consequences of ones’ behavior. During social interactions, the cerebellum may generate internal models and also use social feedback to derive prediction error signals and optimize future social behavior accordingly (Van Overwalle et al., 2020). The cerebellum may function similarly to support language processing; indeed, the cerebellum has been shown to use linguistic context to anticipate future linguistic information (Sokolov et al., 2017). Thus, our findings suggest that the establishment of cerebro-cerebellar circuits implicated in social communication may scaffold infants’ ability to learn from social feedback which tends to be highly probabilistic in nature.
Critically, the cerebellum is thought to facilitate the generation of predictions by keeping track of patterns, or spatio-temporal regularities in the environment (Leggio & Molinari, 2015). Thus, normative cerebellar development may be particularly critical during infancy when there is the most to be learned regarding such regularities and the least amount of prior knowledge (Saffran, 2020). Importantly, contingency learning –both statistical and associative– has been shown to predict later cognitive, social and language functioning. In the realm of statistical learning, better visual statistical learning relates to better social and cognitive functioning in toddlers with ASD (Jeste et al., 2015) and more robust implicit statistical language learning predicts better language skills and fewer ASD symptoms in HR infants (Liu, Tsang, et al., 2020). In the realm of associative learning, delay eye-blink conditioning –a form of associative learning that is highly dependent on the cerebellum (Boele, Koekkoek, & De Zeeuw, 2010; Raymond, Lisberger, & Mauk, 1996)– in infancy is predictive of later social functioning (Reeb-Sutherland, Levitt, & Fox, 2012) and consistently reported to be aberrant in both individuals with ASD and animal models of ASD (Kloth et al., 2015; Oristaglio et al., 2013). In sum, atypicalities in the formation of cerebro-cerebellar circuits early in infancy may perturb the ability to track environmental contingencies and generate predictions, which may cascade into difficulties in learning complex social and language skills. Our findings of altered functional connectivity within cortico-cerebellar circuits in infants who later exhibit socio-communicative impairments lend preliminary evidence to this hypothesis.
Given the conceptual framework whereby social impairments in ASD may be a downstream manifestation of earlier alterations in the development of sensorimotor brain networks (Piven et al., 2017), we also examined functional connectivity within a cerebro-cerebellar circuit specifically implicated in sensorimotor processes. Interestingly, here we did not observe any significant differences across the cohorts. Given that maturation of sensorimotor regions precedes that of social regions during early brain development (Gao, Alcauter, Smith, Gilmore, & Lin, 2015), atypicalities in sensorimotor cerebro-cerebellar circuits may be detectable at an earlier timepoint. The lack of significant differences in this cerebellar sensorimotor circuit may also reflect the nature of our clustering approach whereby we derived cohorts based on receptive language abilities, as an index of socio-communicative function. In fact, while grey matter volume in RcrusI relates to severity of social and communicative deficits in ASD (and to a lesser extent, repetitive and stereotyped behaviors including sensory processing atypicalities), lobule V volume only relates to severity of restrictive, repetitive and stereotyped behaviors including sensory issues (D’Mello et al., 2015). Taken together, our findings suggest that cerebro-cerebellar connectivity may be selectively disrupted in infants who later exhibit socio-communicative impairments, sparing circuits solely involved in sensorimotor processing.
This study presents some limitations. Most notably, we had a modest sample size. Thus, we examined seed-based RcrusI connectivity only with a-priori ROIs, which precluded us from identifying broader atypicalities. Also, as prior studies have revealed that neurodevelopmental trajectories, rather than differences at a particular timepoint, may be more predictive of later ASD symptomatology (Hazlett et al., 2017; Wolff et al., 2012), future longitudinal studies should examine how early in development these cortico-cerebellar networks begin to diverge in infants who later exhibit difficulties with social communication. Lastly, future work should investigate whether atypicalities in cerebro-cerebellar circuits also extend to structural connectivity.
Conclusion
To our knowledge, this is the first study to examine functional connectivity of cerebro-cerebellar circuits implicated in social and language functions in infancy and to investigate whether distinct connectivity patterns relate to later socio-communicative development. We observed hypoconnectivity within these cerebro-cerebellar networks at just 9 months of age in children who later exhibited social communication difficulties, many months before delays overtly manifest at the behavioral level. As cerebro-cerebellar circuits are implicated in prediction, these findings point to probabilistic learning as a potential intermediary mechanism that may be disrupted in early infancy, cascading into alterations in social communication. Further characterizing atypical cerebellar function in infancy may inform early interventions targeting probabilistic learning to promote development along normative trajectories.
Supplementary Material
Supplemental Methods
Table S1. Full Sample - MSEL Receptive Language T-scores.
Table S2. Full Sample – MCDI age-related language trajectories from 9 to 18 months of age.
Table S3. Full Sample - MCDI Number of Words Comprehended and Produced.
Table S4. Neuroimaging (rsfMRI) Sample – MSEL Receptive Language T-scores.
Table S5. Neuroimaging (rsfMRI) Sample – MCDI Number of Words Comprehended and Produced.
Table S6. R crus I Connectivity.
Table S7. Effect Sizes for Functional Connectivity Analyses.
Figure S1. Overview of Resting-state Functional Connectivity Methods.
Figure S2. rsfMRI Sample – Validation of Clustering Method.
Figure S3. rsfMRI Sample – Cohort Membership by ASD Risk Status and Outcome Classification.
Figure S4. Cerebro-Cerebellar Functional Connectivity with Right Crus I – Regressing for RRB.
Figure S5. Additional Post-hoc Analyses: Cerebro-Cerebellar Functional Connectivity with Right Crus I.
Key points.
The cerebellum subserves social/language processing, and cerebellar atypicalities are commonly reported in autism.
However, it remains unknown how cerebellar function in infancy relates to socio-communicative development.
Here, a data-driven clustering method was employed to stratify infants at high/low familial risk for autism into three cohorts –Delayed, Late-Blooming, and Typical– exhibiting unique socio-communicative trajectories from 6 to 36 months. Resting-state fMRI was used to compare cerebro-cerebellar connectivity at 9 months.
Infants with sustained socio-communicative delays exhibited hypo-connectivity within cerebro-cerebellar networks at 9 months, before symptoms overtly manifest
These findings have important implications for early detection/intervention of neurodevelopmental disorders. As the cerebellum is implicated in prediction, these results point to probabilistic learning as an intermediary mechanism disrupted in infancy, cascading into socio-communicative delays.
Acknowledgements
The authors thank the families who generously donated their time to participate in this study.
This work was supported by the National Institute of Child Health and Human Development (P50 HD055784 to S.Y.B.). The authors are grateful for the generous support from the Brain Mapping Medical Research Organization, Brain Mapping Support Foundation, Pierson-Lovelace Foundation, The Ahmanson Foundation, Capital Group Companies Charitable Foundation, William M. and Linda R. Dietel Philanthropic Fund, and Northstar Fund. The content is solely the responsibility of the authors and does not necessarily represent the official views of the National Institutes of Health. The authors have declared that they have no competing or potential conflicts of interest.
Footnotes
Conflict of interest statement: No conflicts declared.
References
- Akkal D, Dum RP, & Strick PL (2007). Supplementary motor area and presupplementary motor area: Targets of basal ganglia and cerebellar output. The Journal of Neuroscience: The Official Journal of the Society for Neuroscience, 27(40), 10659–10673. [DOI] [PMC free article] [PubMed] [Google Scholar]
- Badura A, Verpeut JL, Metzger JW, Pereira TD, Pisano TJ, Deverett B, Bakshinskaya DE, et al. (2018). Normal cognitive and social development require posterior cerebellar activity. ELife, 7, e36401. eLife Sciences Publications, Ltd. [DOI] [PMC free article] [PubMed] [Google Scholar]
- Bates D, Maechler M, Bolker [aut B, cre, Walker S, Christensen RHB, Singmann H, et al. (2020). lme4: Linear Mixed-Effects Models using “Eigen” and S4. Retrieved October 21, 2020, from https://CRAN.R-project.org/package=lme4
- Benjamini Y, & Hochberg Y (1995). Controlling the False Discovery Rate: A Practical and Powerful Approach to Multiple Testing. Journal of the Royal Statistical Society. Series B (Methodological), 57(1), 289–300. [Royal Statistical Society, Wiley]. [Google Scholar]
- Bernard JA, Seidler RD, Hassevoort KM, Benson BL, Welsh RC, Wiggins JL, Jaeggi SM, et al. (2012). Resting state cortico-cerebellar functional connectivity networks: A comparison of anatomical and self-organizing map approaches. Frontiers in Neuroanatomy, 6. Retrieved December 24, 2020, from https://www.ncbi.nlm.nih.gov/pmc/articles/PMC3415673/ [DOI] [PMC free article] [PubMed] [Google Scholar]
- Blasi A, Lloyd-Fox S, Sethna V, Brammer MJ, Mercure E, Murray L, Williams SCR, et al. (2015). Atypical processing of voice sounds in infants at risk for autism spectrum disorder. Cortex; a Journal Devoted to the Study of the Nervous System and Behavior, 71, 122–133. [DOI] [PMC free article] [PubMed] [Google Scholar]
- Boele H-J, Koekkoek SKE, & De Zeeuw CI (2010). Cerebellar and extracerebellar involvement in mouse eyeblink conditioning: The ACDC model. Frontiers in Cellular Neuroscience, 3. Frontiers. Retrieved January 18, 2021, from 10.3389/neuro.03.019.2009/full [DOI] [PMC free article] [PubMed] [Google Scholar]
- Bostan AC, Dum RP, & Strick PL (2010). The basal ganglia communicate with the cerebellum. Proceedings of the National Academy of Sciences, 107(18), 8452–8456. National Academy of Sciences. [DOI] [PMC free article] [PubMed] [Google Scholar]
- Brian AJ, Roncadin C, Duku E, Bryson SE, Smith IM, Roberts W, Szatmari P, et al. (2014). Emerging cognitive profiles in high-risk infants with and without autism spectrum disorder. Research in Autism Spectrum Disorders, 8(11), 1557–1566. [Google Scholar]
- Bryson SE, Zwaigenbaum L, McDermott C, Rombough V, & Brian J (2008). The Autism Observation Scale for Infants: Scale development and reliability data. Journal of Autism and Developmental Disorders, 38(4), 731–738. [DOI] [PubMed] [Google Scholar]
- Buckner RL, Krienen FM, Castellanos A, Diaz JC, & Yeo BTT (2011). The organization of the human cerebellum estimated by intrinsic functional connectivity. Journal of Neurophysiology, 106(5), 2322–2345. [DOI] [PMC free article] [PubMed] [Google Scholar]
- Catani M, Jones DK, Daly E, Embiricos N, Deeley Q, Pugliese L, Curran S, et al. (2008). Altered cerebellar feedback projections in Asperger syndrome. NeuroImage, 41(4), 1184–1191. [DOI] [PubMed] [Google Scholar]
- Chen SHA, & Desmond JE (2005). Cerebrocerebellar networks during articulatory rehearsal and verbal working memory tasks. NeuroImage, 24(2), 332–338. [DOI] [PubMed] [Google Scholar]
- Ciarrusta J, O’Muircheartaigh J, Dimitrova R, Batalle D, Cordero-Grande L, Price A, Hughes E, et al. (2019). Social Brain Functional Maturation in Newborn Infants With and Without a Family History of Autism Spectrum Disorder. JAMA Network Open, 2(4), e191868–e191868. [DOI] [PMC free article] [PubMed] [Google Scholar]
- DeRamus TP, & Kana RK (2015). Anatomical likelihood estimation meta-analysis of grey and white matter anomalies in autism spectrum disorders. NeuroImage: Clinical, 7, 525–536. [DOI] [PMC free article] [PubMed] [Google Scholar]
- Diedrichsen J, Balsters JH, Flavell J, Cussans E, & Ramnani N (2009). A probabilistic MR atlas of the human cerebellum. NeuroImage, 46(1), 39–46. [DOI] [PubMed] [Google Scholar]
- D’Mello AM, Crocetti D, Mostofsky SH, & Stoodley CJ (2015). Cerebellar gray matter and lobular volumes correlate with core autism symptoms. NeuroImage: Clinical, 7, 631–639. [DOI] [PMC free article] [PubMed] [Google Scholar]
- D’Mello AM, Moore DM, Crocetti D, Mostofsky SH, & Stoodley CJ (2016a). Cerebellar gray matter differentiates children with early language delay in autism. Autism Research, 9(11), 1191–1204. [DOI] [PMC free article] [PubMed] [Google Scholar]
- D’Mello AM, Moore DM, Crocetti D, Mostofsky SH, & Stoodley CJ (2016b). Cerebellar gray matter differentiates children with early language delay in autism. Autism Research, 9(11), 1191–1204. [DOI] [PMC free article] [PubMed] [Google Scholar]
- D’Mello AM, & Stoodley CJ (2015). Cerebro-cerebellar circuits in autism spectrum disorder. Frontiers in Neuroscience, 9. Frontiers. Retrieved September 22, 2020, from 10.3389/fnins.2015.00408/full [DOI] [PMC free article] [PubMed] [Google Scholar]
- D’Mello AM, Turkeltaub PE, & Stoodley CJ (2017). Cerebellar tDCS Modulates Neural Circuits during Semantic Prediction: A Combined tDCS-fMRI Study. Journal of Neuroscience, 37(6), 1604–1613. Society for Neuroscience. [DOI] [PMC free article] [PubMed] [Google Scholar]
- E K-H, Chen S-HA, Ho M-HR, & Desmond JE (2014). A meta-analysis of cerebellar contributions to higher cognition from PET and fMRI studies. Human Brain Mapping, 35(2), 593–615. [DOI] [PMC free article] [PubMed] [Google Scholar]
- Emerson RW, Adams C, Nishino T, Hazlett HC, Wolff JJ, Zwaigenbaum L, Constantino JN, et al. (2017). Functional neuroimaging of high-risk 6-month-old infants predicts a diagnosis of autism at 24 months of age. Science Translational Medicine, 9(393). American Association for the Advancement of Science. Retrieved March 1, 2021, from https://stm.sciencemag.org/content/9/393/eaag2882 [DOI] [PMC free article] [PubMed] [Google Scholar]
- Fatemi SH, Aldinger KA, Ashwood P, Bauman ML, Blaha CD, Blatt GJ, Chauhan A, et al. (2012). Consensus Paper: Pathological Role of the Cerebellum in Autism. The Cerebellum, 11(3), 777–807. [DOI] [PMC free article] [PubMed] [Google Scholar]
- Fenson L, Marchman VA, Thal D, Dale P, Reznick J, & Bates E (2007). MacArthur-Bates Communicative Development Inventories: User’s guide and technical manual (2nd ed.). Baltimore, MD: Brookes. [Google Scholar]
- Fermin ASR, Yoshida T, Yoshimoto J, Ito M, Tanaka SC, & Doya K (2016). Model-based action planning involves cortico-cerebellar and basal ganglia networks. Scientific Reports, 6(1), 31378. Nature Publishing Group. [DOI] [PMC free article] [PubMed] [Google Scholar]
- Gammer I, Bedford R, Elsabbagh M, Garwood H, Pasco G, Tucker L, Volein A, et al. (2015). Behavioural markers for autism in infancy: Scores on the Autism Observational Scale for Infants in a prospective study of at-risk siblings. Infant Behavior & Development, 38, 107–115. [DOI] [PMC free article] [PubMed] [Google Scholar]
- Gao W, Alcauter S, Smith JK, Gilmore JH, & Lin W (2015). Development of human brain cortical network architecture during infancy. Brain Structure and Function, 220(2), 1173–1186. [DOI] [PMC free article] [PubMed] [Google Scholar]
- Garrido D, Petrova D, Watson LR, Garcia-Retamero R, & Carballo G (2017). Language and motor skills in siblings of children with autism spectrum disorder: A meta-analytic review. Autism Research, 10(11), 1737–1750. [DOI] [PubMed] [Google Scholar]
- Genolini C, Alacoque X, Sentenac M, & Arnaud C (2015). kml and kml3d: R Packages to Cluster Longitudinal Data. Journal of Statistical Software, 65(1), 1–34. [Google Scholar]
- Genolini C, & Falissard B (2010). KmL: K-means for longitudinal data. Computational Statistics, 25(2), 317–328. [Google Scholar]
- Georgiades S, Szatmari P, Zwaigenbaum L, Bryson S, Brian J, Roberts W, Smith I, et al. (2013). A Prospective Study of Autistic-Like Traits in Unaffected Siblings of Probands With Autism Spectrum Disorder. JAMA Psychiatry, 70(1), 42. [DOI] [PubMed] [Google Scholar]
- Gotham K, Pickles A, & Lord C (2009). Standardizing ADOS scores for a measure of severity in autism spectrum disorders. Journal of Autism and Developmental Disorders, 39(5), 693–705. [DOI] [PMC free article] [PubMed] [Google Scholar]
- Guell X, Gabrieli JDE, & Schmahmann JD (2018). Triple representation of language, working memory, social and emotion processing in the cerebellum: Convergent evidence from task and seed-based resting-state fMRI analyses in a single large cohort. NeuroImage, 172, 437–449. [DOI] [PMC free article] [PubMed] [Google Scholar]
- Hazlett HC, Gu H, Munsell BC, Kim SH, Styner M, Wolff JJ, Elison JT, et al. (2017). Early brain development in infants at high risk for autism spectrum disorder. Nature, 542(7641), 348–351. Nature Publishing Group. [DOI] [PMC free article] [PubMed] [Google Scholar]
- Heleven E, van Dun K, & Van Overwalle F (2019). The posterior Cerebellum is involved in constructing Social Action Sequences: An fMRI Study. Scientific Reports, 9(1), 11110. Nature Publishing Group. [DOI] [PMC free article] [PubMed] [Google Scholar]
- Hoshi E, Tremblay L, Féger J, Carras PL, & Strick PL (2005). The cerebellum communicates with the basal ganglia. Nature Neuroscience, 8(11), 1491–1493. [DOI] [PubMed] [Google Scholar]
- Hudry K, Chandler S, Bedford R, Pasco G, Gliga T, Elsabbagh M, Johnson MH, et al. (2014). Early Language Profiles in Infants at High-Risk for Autism Spectrum Disorders. Journal of Autism and Developmental Disorders, 44(1), 154–167. [DOI] [PubMed] [Google Scholar]
- Hudry K, Leadbitter K, Temple K, Slonims V, McConachie H, Aldred C, Howlin P, et al. (2010). Preschoolers with autism show greater impairment in receptive compared with expressive language abilities. International Journal of Language & Communication Disorders, 45(6), 681–690. [DOI] [PubMed] [Google Scholar]
- Ito M (2008). Control of mental activities by internal models in the cerebellum. Nature Reviews Neuroscience, 9(4), 304–313. Nature Publishing Group. [DOI] [PubMed] [Google Scholar]
- Jeste SS, Kirkham N, Senturk D, Hasenstab K, Sugar C, Kupelian C, Baker E, et al. (2015). Electrophysiological evidence of heterogeneity in visual statistical learning in young children with ASD. Developmental science, 18(1), 90–105. [DOI] [PMC free article] [PubMed] [Google Scholar]
- Jones BL, Nagin DS, & Roeder K (2001). A SAS Procedure Based on Mixture Models for Estimating Developmental Trajectories. Sociological Methods & Research, 29(3), 374–393. SAGE Publications Inc. [Google Scholar]
- Kelly E, Escamilla CO, & Tsai PT (2020). Cerebellar Dysfunction in Autism Spectrum Disorders: Deriving Mechanistic Insights from an Internal Model Framework. Neuroscience. Retrieved December 11, 2020, from http://www.sciencedirect.com/science/article/pii/S0306452220307296 [DOI] [PMC free article] [PubMed]
- Kelly E, Meng F, Fujita H, Morgado F, Kazemi Y, Rice LC, Ren C, et al. (2020). Regulation of autism-relevant behaviors by cerebellar–prefrontal cortical circuits. Nature Neuroscience, 23(9), 1102–1110. Nature Publishing Group. [DOI] [PMC free article] [PubMed] [Google Scholar]
- Kelly RM, & Strick PL (2003). Cerebellar Loops with Motor Cortex and Prefrontal Cortex of a Nonhuman Primate. Journal of Neuroscience, 23(23), 8432–8444. Society for Neuroscience. [DOI] [PMC free article] [PubMed] [Google Scholar]
- Khan AJ, Nair A, Keown CL, Datko MC, Lincoln AJ, & Müller R-A (2015). Cerebro-cerebellar Resting-State Functional Connectivity in Children and Adolescents with Autism Spectrum Disorder. Biological Psychiatry, 78(9), 625–634. [DOI] [PMC free article] [PubMed] [Google Scholar]
- King M, Hernandez-Castillo CR, Poldrack RA, Ivry RB, & Diedrichsen J (2019). Functional boundaries in the human cerebellum revealed by a multi-domain task battery. Nature Neuroscience, 22(8), 1371–1378. Nature Publishing Group. [DOI] [PMC free article] [PubMed] [Google Scholar]
- Kloth AD, Badura A, Li A, Cherskov A, Connolly SG, Giovannucci A, Bangash MA, et al. (2015). Cerebellar associative sensory learning defects in five mouse autism models. ELife, 4, e06085. [DOI] [PMC free article] [PubMed] [Google Scholar]
- Kotz SA, & Schwartze M (2010). Cortical speech processing unplugged: A timely subcortico-cortical framework. Trends in Cognitive Sciences, 14(9), 392–399. [DOI] [PubMed] [Google Scholar]
- Krienen FM, & Buckner RL (2009). Segregated fronto-cerebellar circuits revealed by intrinsic functional connectivity. Cerebral Cortex (New York, N.Y.: 1991), 19(10), 2485–2497. [DOI] [PMC free article] [PubMed] [Google Scholar]
- Kuhl PK (2007). Is speech learning ‘gated’ by the social brain? Developmental Science, 10(1), 110–120. [DOI] [PubMed] [Google Scholar]
- Kuhl PK, Coffey-Corina S, Padden D, & Dawson G (2005). Links between social and linguistic processing of speech in preschool children with autism: Behavioral and electrophysiological measures. Developmental Science, 8(1), F1–F12. [DOI] [PubMed] [Google Scholar]
- Kuhl PK, Tsao F-M, & Liu H-M (2003). Foreign-language experience in infancy: Effects of short-term exposure and social interaction on phonetic learning. Proceedings of the National Academy of Sciences, 100(15), 9096–9101. National Academy of Sciences. [DOI] [PMC free article] [PubMed] [Google Scholar]
- Landa RJ, Gross AL, Stuart EA, & Bauman M (2012). Latent class analysis of early developmental trajectory in baby siblings of children with autism. Journal of Child Psychology and Psychiatry, 53(9), 986–996. [DOI] [PMC free article] [PubMed] [Google Scholar]
- Lee E, Lee J, & Kim E (2017). Excitation/Inhibition Imbalance in Animal Models of Autism Spectrum Disorders. Biological Psychiatry, Cortical Excitation-Inhibition Balance and Dysfunction in Psychiatric Disorders, 81(10), 838–847. [DOI] [PubMed] [Google Scholar]
- Leggio M, & Molinari M (2015). Cerebellar sequencing: A trick for predicting the future. Cerebellum (London, England), 14(1), 35–38. [DOI] [PubMed] [Google Scholar]
- Lenth R, Buerkner P, Herve M, Love J, Riebl H, & Singmann H (2020). emmeans: Estimated Marginal Means, aka Least-Squares Means. Retrieved October 21, 2020, from https://CRAN.R-project.org/package=emmeans
- Lesage E, Hansen PC, & Miall RC (2017). Right Lateral Cerebellum Represents Linguistic Predictability. Journal of Neuroscience, 37(26), 6231–6241. Society for Neuroscience. [DOI] [PMC free article] [PubMed] [Google Scholar]
- Lesage E, Nailer EL, & Miall RC (2016). Cerebellar BOLD signal during the acquisition of a new lexicon predicts its early consolidation. Brain and Language, Contributions of the Cerebellum to Language Functions, 161, 33–44. [DOI] [PMC free article] [PubMed] [Google Scholar]
- Lewis JD, Evans AC, Pruett JR, Botteron KN, McKinstry RC, Zwaigenbaum L, Estes AM, et al. (2017). The Emergence of Network Inefficiencies in Infants With Autism Spectrum Disorder. Biological Psychiatry, Alterations in Cortical Development in Autism Spectrum Disorder, 82(3), 176–185. [DOI] [PMC free article] [PubMed] [Google Scholar]
- Lidstone DE, Rochowiak R, Mostofsky SH, & Nebel MB (2021). A Data Driven Approach Reveals That Anomalous Motor System Connectivity is Associated With the Severity of Core Autism Symptoms. Autism Research, n/a(n/a). Retrieved September 7, 2021, from 10.1002/aur.2476 [DOI] [PMC free article] [PubMed] [Google Scholar]
- Liu J, Okada NJ, Cummings KK, Jung J, Patterson G, Bookheimer SY, Jeste SS, et al. (2020). Emerging atypicalities in functional connectivity of language-related networks in young infants at high familial risk for ASD. Developmental Cognitive Neuroscience, 45, 100814. [DOI] [PMC free article] [PubMed] [Google Scholar]
- Liu J, Tsang T, Jackson L, Ponting C, Jeste SS, Bookheimer SY, & Dapretto M (2019). Altered lateralization of dorsal language tracts in 6-week-old infants at risk for autism. Developmental Science, 22(3), e12768. [DOI] [PMC free article] [PubMed] [Google Scholar]
- Liu J, Tsang T, Ponting C, Jackson L, Jeste SS, Bookheimer SY, & Dapretto M (2020). Lack of neural evidence for implicit language learning in 9-month-old infants at high risk for autism. Developmental Science, n/a(n/a), e13078. [DOI] [PMC free article] [PubMed] [Google Scholar]
- Longard J, Brian J, Zwaigenbaum L, Duku E, Moore C, Smith IM, Garon N, et al. (2017). Early expressive and receptive language trajectories in high-risk infant siblings of children with autism spectrum disorder. Autism & Developmental Language Impairments, 2, 2396941517737418. SAGE Publications Ltd. [Google Scholar]
- Lord C, Rutter M, DiLavore P, Risi S, Gotham K, & Bishop S (2012). Autism diagnostic observations schedule (2nd ed.). Western Psychological Services. [Google Scholar]
- Luyster R, Gotham K, Guthrie W, Coffing M, Petrak R, Pierce K, Bishop S, et al. (2009). The Autism Diagnostic Observation Schedule-toddler module: A new module of a standardized diagnostic measure for autism spectrum disorders. Journal of Autism and Developmental Disorders, 39(9), 1305–1320. [DOI] [PMC free article] [PubMed] [Google Scholar]
- Luyster RJ, Kadlec MB, Carter A, & Tager-Flusberg H (2008). Language assessment and development in toddlers with autism spectrum disorders. Journal of Autism and Developmental Disorders, 38(8), 1426–1438. [DOI] [PubMed] [Google Scholar]
- Lytle SR, & Kuhl PK (2017). Social Interaction and Language Acquisition. The Handbook of Psycholinguistics (pp. 615–634). John Wiley & Sons, Ltd. Retrieved March 4, 2021, from 10.1002/9781118829516.ch27 [DOI] [Google Scholar]
- Mariën P, Ackermann H, Adamaszek M, Barwood CHS, Beaton A, Desmond J, De Witte E, et al. (2014). Consensus Paper: Language and the Cerebellum: an Ongoing Enigma. The Cerebellum, 13(3), 386–410. [DOI] [PMC free article] [PubMed] [Google Scholar]
- Marvel CL, & Desmond JE (2012a). From storage to manipulation: How the neural correlates of verbal working memory reflect varying demands on inner speech. Brain and Language, 120(1), 42–51. [DOI] [PMC free article] [PubMed] [Google Scholar]
- Marvel CL, & Desmond JE (2012b). From storage to manipulation: How the neural correlates of verbal working memory reflect varying demands on inner speech. Brain and Language, 120(1), 42–51. [DOI] [PMC free article] [PubMed] [Google Scholar]
- Miall RC, Antony J, Goldsmith-Sumner A, Harding SR, McGovern C, & Winter JL (2016). Modulation of linguistic prediction by TDCS of the right lateral cerebellum. Neuropsychologia, 86, 103–109. [DOI] [PMC free article] [PubMed] [Google Scholar]
- Middleton FA, & Strick PL (2001). Cerebellar Projections to the Prefrontal Cortex of the Primate. Journal of Neuroscience, 21(2), 700–712. Society for Neuroscience. [DOI] [PMC free article] [PubMed] [Google Scholar]
- Mullen E (1995). Mullen Scales of Early Learning (AGS ed.). Circle Pines, Minnesota: American Guidance Service Inc. [Google Scholar]
- Mundy P, Delgado C, Goldstein J, Parlade M, Hogan A, Seibert J, & Mundy D (2003). Early social communication scales (ESCS), 305. [Google Scholar]
- Oristaglio J, West SH, Ghaffari M, Lech MS, Verma BR, Harvey JA, Welsh JP, et al. (2013). Children with autism spectrum disorders show abnormal conditioned response timing on delay, but not trace, eyeblink conditioning. Neuroscience, 248, 708–718. [DOI] [PMC free article] [PubMed] [Google Scholar]
- Piven J, Elison JT, & Zylka MJ (2017). Toward a conceptual framework for early brain and behavior development in autism. Molecular Psychiatry, 22(10), 1385–1394. Nature Publishing Group. [DOI] [PMC free article] [PubMed] [Google Scholar]
- Pote I, Wang S, Sethna V, Blasi A, Daly E, Kuklisova-Murgasova M, Lloyd-Fox S, et al. (2019). Familial risk of autism alters subcortical and cerebellar brain anatomy in infants and predicts the emergence of repetitive behaviors in early childhood. Autism Research: Official Journal of the International Society for Autism Research, 12(4), 614–627. [DOI] [PMC free article] [PubMed] [Google Scholar]
- Power JD, Mitra A, Laumann TO, Snyder AZ, Schlaggar BL, & Petersen SE (2014). Methods to detect, characterize, and remove motion artifact in resting state fMRI. NeuroImage, 84, 320–341. [DOI] [PMC free article] [PubMed] [Google Scholar]
- Pruim RHR, Mennes M, van Rooij D, Llera A, Buitelaar JK, & Beckmann CF (2015). ICA-AROMA: A robust ICA-based strategy for removing motion artifacts from fMRI data. NeuroImage, 112, 267–277. [DOI] [PubMed] [Google Scholar]
- R Core Team. (2020). R: A language and environment for statistical computing. R Foundation for Statistical Computing. Vienna, Austria. Retrieved from https://www.R-project.org/ [Google Scholar]
- Ramnani N (2006). The primate cortico-cerebellar system: Anatomy and function. Nature Reviews. Neuroscience, 7(7), 511–522. [DOI] [PubMed] [Google Scholar]
- Raymond JL, Lisberger SG, & Mauk MD (1996). The Cerebellum: A Neuronal Learning Machine? Science, 272(5265), 1126–1131. American Association for the Advancement of Science. [DOI] [PubMed] [Google Scholar]
- Reeb-Sutherland BC, Levitt P, & Fox NA (2012). The Predictive Nature of Individual Differences in Early Associative Learning and Emerging Social Behavior. PLOS ONE, 7(1), e30511. Public Library of Science. [DOI] [PMC free article] [PubMed] [Google Scholar]
- Rubenstein JLR, & Merzenich MM (2003). Model of autism: Increased ratio of excitation/inhibition in key neural systems. Genes, Brain, and Behavior, 2(5), 255–267. [DOI] [PMC free article] [PubMed] [Google Scholar]
- Saffran JR (2020). Statistical Language Learning in Infancy. Child Development Perspectives, 14(1), 49–54. [DOI] [PMC free article] [PubMed] [Google Scholar]
- Shi F, Yap P-T, Wu G, Jia H, Gilmore JH, Lin W, & Shen D (2011). Infant Brain Atlases from Neonates to 1- and 2-Year-Olds. PLOS ONE, 6(4), e18746. Public Library of Science. [DOI] [PMC free article] [PubMed] [Google Scholar]
- Skefos J, Cummings C, Enzer K, Holiday J, Weed K, Levy E, Yuce T, et al. (2014). Regional Alterations in Purkinje Cell Density in Patients with Autism. PLOS ONE, 9(2), e81255. Public Library of Science. [DOI] [PMC free article] [PubMed] [Google Scholar]
- Smith SM, Jenkinson M, Woolrich MW, Beckmann CF, Behrens TEJ, Johansen-Berg H, Bannister PR, et al. (2004). Advances in functional and structural MR image analysis and implementation as FSL. NeuroImage, Mathematics in Brain Imaging, 23, S208–S219. [DOI] [PubMed] [Google Scholar]
- Sokolov AA, Miall RC, & Ivry RB (2017). The Cerebellum: Adaptive Prediction for Movement and Cognition. Trends in Cognitive Sciences, 21(5), 313–332. [DOI] [PMC free article] [PubMed] [Google Scholar]
- Stoodley CJ (2014). Distinct regions of the cerebellum show gray matter decreases in autism, ADHD, and developmental dyslexia. Frontiers in Systems Neuroscience, 8. Frontiers. Retrieved December 24, 2020, from 10.3389/fnsys.2014.00092/full [DOI] [PMC free article] [PubMed] [Google Scholar]
- Stoodley CJ, D’Mello AM, Ellegood J, Jakkamsetti V, Liu P, Nebel MB, Gibson JM, et al. (2017). Altered cerebellar connectivity in autism and cerebellar-mediated rescue of autism-related behaviors in mice. Nature Neuroscience, 20(12), 1744–1751. Nature Publishing Group. [DOI] [PMC free article] [PubMed] [Google Scholar]
- Strick PL, Dum RP, & Fiez JA (2009). Cerebellum and Nonmotor Function. Annual Review of Neuroscience, 32(1), 413–434. [DOI] [PubMed] [Google Scholar]
- Tager-Flusberg H, Paul R, & Lord C (2005). Language and Communication in Autism. In Volkmar FR, Paul R, Klin A, & Cohen D (Eds.), Handbook of Autism and Pervasive Developmental Disorders (1st ed., pp. 335–364). Wiley. Retrieved December 25, 2020, from 10.1002/9780470939345.ch12 [DOI] [Google Scholar]
- Tamir DI, & Thornton MA (2018). Modeling the Predictive Social Mind. Trends in Cognitive Sciences, 22(3), 201–212. [DOI] [PMC free article] [PubMed] [Google Scholar]
- Tran XA, McDonald N, Dickinson A, Scheffler A, Frohlich J, Marin A, Liu CK, et al. (2021). Functional connectivity during language processing in 3-month-old infants at familial risk for autism spectrum disorder. European Journal of Neuroscience, 53(5), 1621–1637. [DOI] [PubMed] [Google Scholar]
- Van Overwalle F, Manto M, Cattaneo Z, Clausi S, Ferrari C, Gabrieli JDE, Guell X, et al. (2020). Consensus Paper: Cerebellum and Social Cognition. The Cerebellum. Retrieved September 22, 2020, from 10.1007/s12311-020-01155-1 [DOI] [PMC free article] [PubMed] [Google Scholar]
- Van Overwalle F, & Mariën P (2016). Functional connectivity between the cerebrum and cerebellum in social cognition: A multi-study analysis. NeuroImage, 124, 248–255. [DOI] [PubMed] [Google Scholar]
- Van Overwalle F, Van de Steen F, & Mariën P (2019). Dynamic causal modeling of the effective connectivity between the cerebrum and cerebellum in social mentalizing across five studies. Cognitive, Affective, & Behavioral Neuroscience, 19(1), 211–223. [DOI] [PubMed] [Google Scholar]
- Verly M, Verhoeven J, Zink I, Mantini D, Peeters R, Deprez S, Emsell L, et al. (2014a). Altered functional connectivity of the language network in ASD: Role of classical language areas and cerebellum. NeuroImage: Clinical, 4, 374–382. [DOI] [PMC free article] [PubMed] [Google Scholar]
- Verly M, Verhoeven J, Zink I, Mantini D, Peeters R, Deprez S, Emsell L, et al. (2014b). Altered functional connectivity of the language network in ASD: Role of classical language areas and cerebellum. NeuroImage: Clinical, 4, 374–382. [DOI] [PMC free article] [PubMed] [Google Scholar]
- Wolff JJ, Gu H, Gerig G, Elison JT, Styner M, Gouttard S, Botteron KN, et al. (2012). Differences in white matter fiber tract development present from 6 to 24 months in infants with autism. The American Journal of Psychiatry, 169(6), 589–600. [DOI] [PMC free article] [PubMed] [Google Scholar]
- Wolff JJ, Jacob S, & Elison JT (2018). The journey to autism: Insights from neuroimaging studies of infants and toddlers. Development and Psychopathology, 30(2), 479–495. Cambridge University Press. [DOI] [PMC free article] [PubMed] [Google Scholar]
- Wolff JJ, Swanson MR, Elison JT, Gerig G, Pruett JR, Styner MA, Vachet C, et al. (2017). Neural circuitry at age 6 months associated with later repetitive behavior and sensory responsiveness in autism. Molecular Autism, 8(1), 8. [DOI] [PMC free article] [PubMed] [Google Scholar]
Associated Data
This section collects any data citations, data availability statements, or supplementary materials included in this article.
Supplementary Materials
Supplemental Methods
Table S1. Full Sample - MSEL Receptive Language T-scores.
Table S2. Full Sample – MCDI age-related language trajectories from 9 to 18 months of age.
Table S3. Full Sample - MCDI Number of Words Comprehended and Produced.
Table S4. Neuroimaging (rsfMRI) Sample – MSEL Receptive Language T-scores.
Table S5. Neuroimaging (rsfMRI) Sample – MCDI Number of Words Comprehended and Produced.
Table S6. R crus I Connectivity.
Table S7. Effect Sizes for Functional Connectivity Analyses.
Figure S1. Overview of Resting-state Functional Connectivity Methods.
Figure S2. rsfMRI Sample – Validation of Clustering Method.
Figure S3. rsfMRI Sample – Cohort Membership by ASD Risk Status and Outcome Classification.
Figure S4. Cerebro-Cerebellar Functional Connectivity with Right Crus I – Regressing for RRB.
Figure S5. Additional Post-hoc Analyses: Cerebro-Cerebellar Functional Connectivity with Right Crus I.