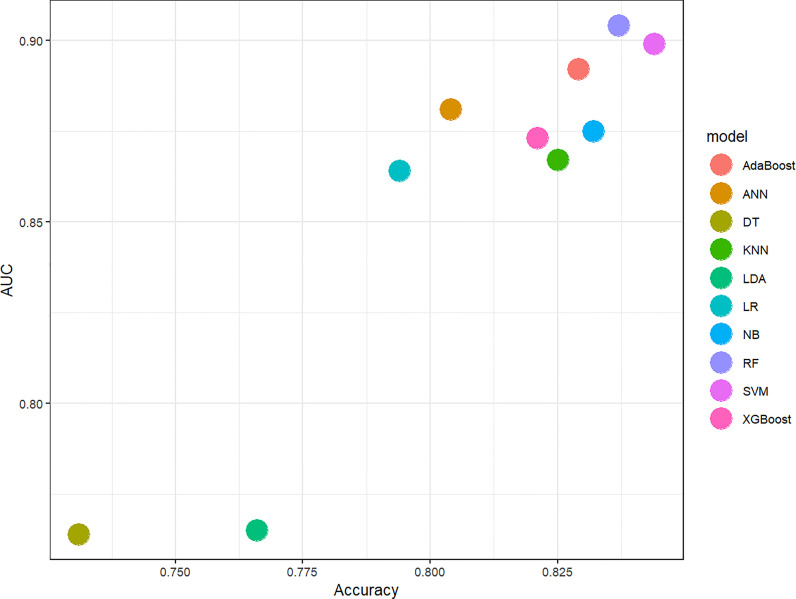
Figure 3.
Scatter diagram of machine learning classifiers prediction performance. The horizontal axis represents ACC, the vertical axis represents AUC. AUC, The area under the receiver operating characteristic curve; ACC, Accuracy; LR, Logistic Regression; LDA, Linear Discriminant Analysis; NB, Naive Bayes; KNN, K-Nearest Neighbor; SVM, Support Vector Machine; DT, Decision Tree; RF, Random Forest; XGBoost, eXtreme Gradient Boosting; ANN, Artificial Neural Network.

