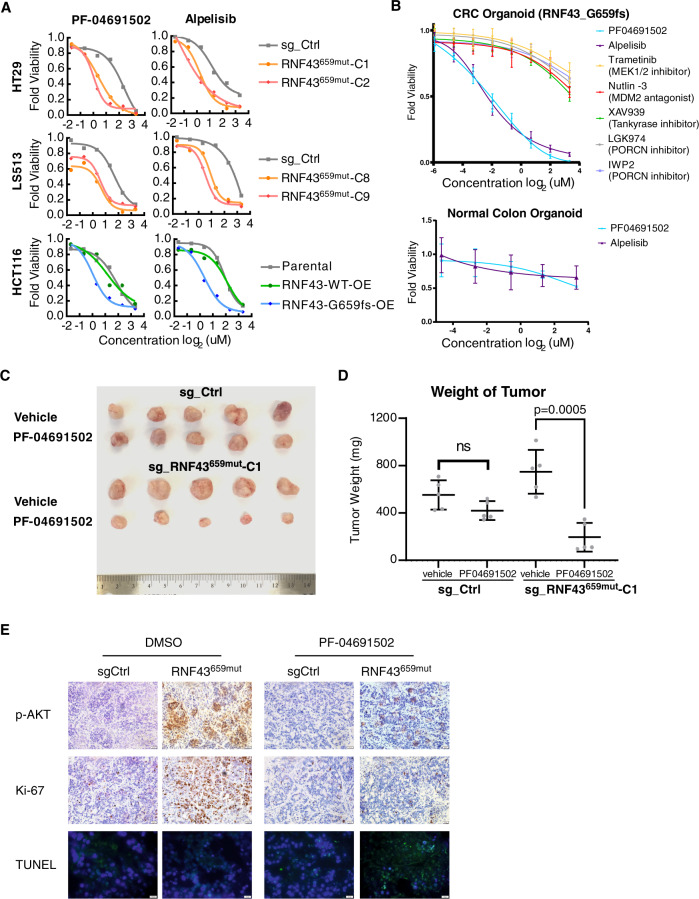
Fig. 3. Assessment of PI3K/mTOR compound efficacy in CRC RNF43_659fs preclinical models.
A Alpelisib and PF-04691502 dose-response curves in either RNF43659mut edited cells (HT29, LS513) or ectopically expressing (OE) RNF43_G659Vfs*41 cells (HCT116) compared to controls. Experiments were performed in triplicate. B Dose-response curve of alpelisib and PF-04691502, along with an MDM2 antagonist and MEK, tankyrase, and PORCN inhibitors, in patient-derived CRC organoids harboring RNF43_G659fs and normal colon organoids. C Image representation of mouse tumor size after placebo or PF-04691502 treatment in cell-derived xenografts harboring either HT29 sg_Ctrl or HT29 sg_RNF43659mut. D Quantification of tumor weight after placebo or PF-04691502 treatment in cell-derived xenograft harboring either HT29 sg_Ctrl or HT29 sg_RNF43659mut. Data are the mean ± SD. Two-sided Student’s t test (n = 5 mice/group). E Representative immunohistochemistry images of p-AKT (S473), Ki-67 and TUNEL-positive cells in HT29_sg-Ctrl or HT29_RNF43659mut-C1 tumors from mice treated with vehicle or PF-04691502. Scale bar 10 μm. Source data are provided as a Source Data file.

