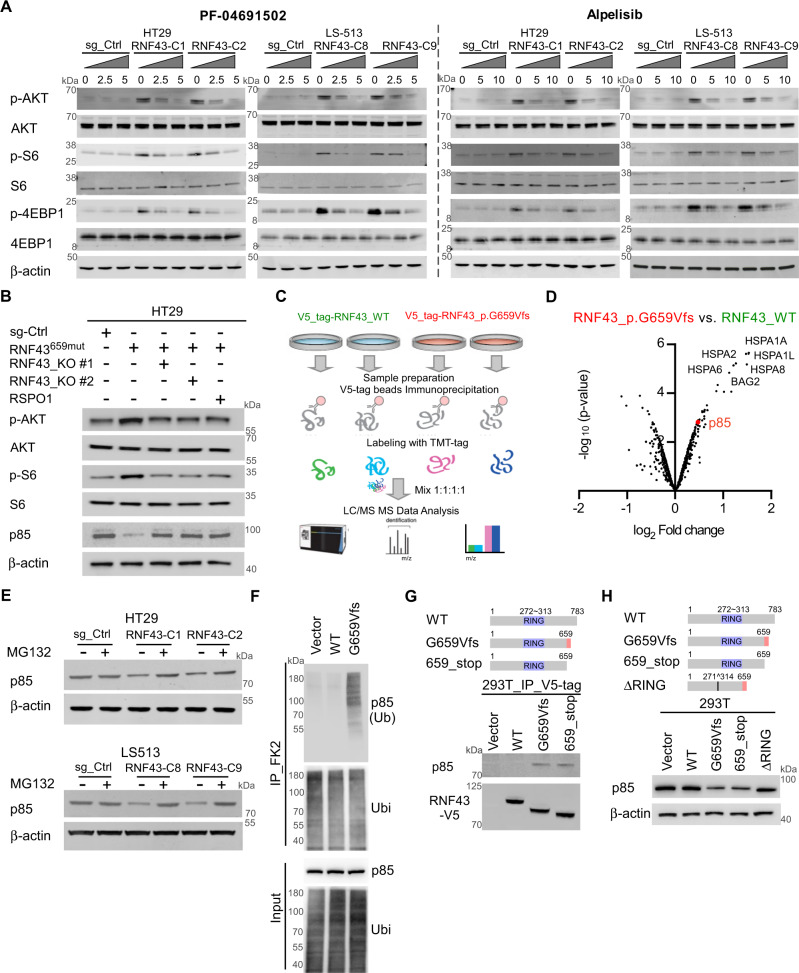
Fig. 4. PI3K/AKT activation by RNF43_G659Vfs and quantitative proteomic profiling of RNF43_G659Vfs.
A Expression of p-AKT, p-S6, and p-4EBP1 in RNF43659mut edited and sg_Ctrl isogenic HT29 and LS513 cells after 48 h treatment with PF-04691502 (left) or alpelisib (right). β-Actin was used as a loading control. B p-AKT (S473), AKT, p-S6 (S235/236), S6, and p85 in sg-Ctrl and RNF43659mut cells alone or with sg-RNF43-KO or RSPO1 (500 ng/ml) treatment. C Schematic representation of the quantitative proteomics workflow used to analyze RNF43 p.G659Vfs protein–protein interactions. Schematic created with BioRender.com. D Volcano plot illustrating the significance (y-axis) and magnitude (x-axis) of protein–protein interactions enriched in RNF43-p.G659Vfs*41 relative to RNF43-wildtype (WT) as detected by immunoprecipitation–mass spectrometry. E p85 expression in RNF43659mut edited isogenic and sg_Ctrl CRC cells with and without MG132 treatment. F Ubiquitin immunoprecipitation assay assessing p85 ubiquitination in vector, RNF43_WT (WT), and RNF43-G659Vfs*41 (G659Vfs) expressing 293T cells. G Binding between p85 and RNF43-WT (WT), RNF43-G659Vfs*41 (G659Vfs) and RNF43-N terminal from 1aa to 659aa truncation (659_stop). H p85 expression in 293T cells transfected with RNF43-WT (WT), RNF43_G659Vfs (G659Vfs), RNF43_659_stop (659_stop), or RNF43_659ΔRING (ΔRING). Source data are provided as a Source Data file.

