Figure 4.
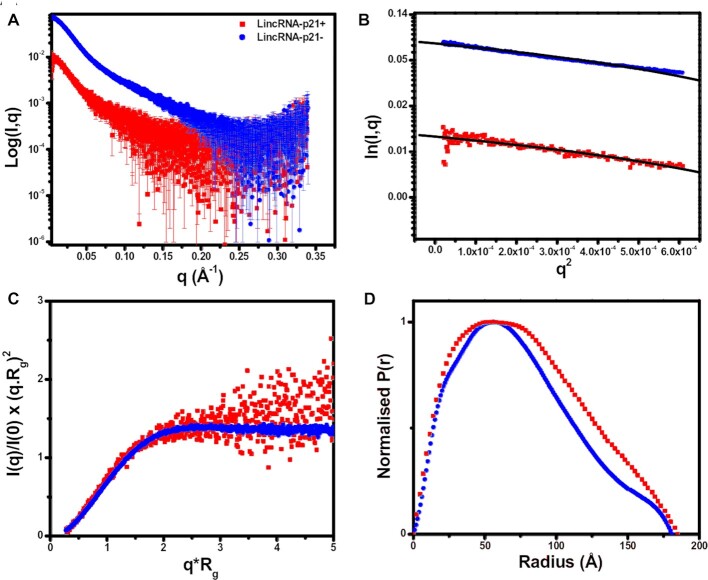
Small Angle X-Ray Scattering (SAXS) Characterisation of Sense (red) and Antisense (blue) LincRNA-p21 AluSx1 RNA. (A) merged scattering data of sense and antisense AluSx1 RNA depicting the scattering intensity (log I(q)) vs. scattering angle (q = 4πsinθ/λ). (B) Guinier plots allowing for the determination of Rg from the low-angle region data and representing the homogeneity of samples. (C) Dimensionless Kratky plots (I(q)/I(0)*(q*Rg)2 vs. q*Rg) of sense and antisense AluSx1 RNA depicting the elongated, tube-like structures because of the non-Gaussian, levelled-plateau shape of the curve. (D) Normalised pair distance distribution plots for sense and antisense AluSx1 RNA which permits the determination of Rg derived from the SAXS dataset and including each molecule's Dmax.

