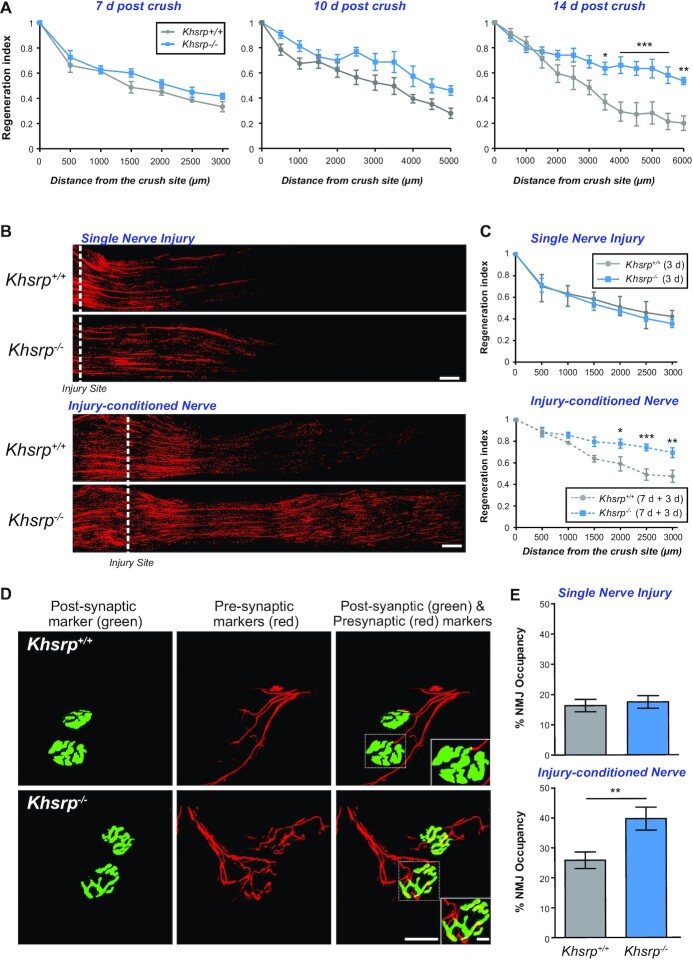
Figure 3.
KHSRP deletion increases in vivo axon regeneration after a conditioning sciatic nerve injury. (A) Regeneration indices calculated as fraction of SCG10 axonal profiles at injury site (0 μm) are shown as mean ± SEM as indicated. There was no significant differences between Khsrp–/– and Khsrp+/+ mice at 7 and 10 days post-injury, but significant differences are seen between the genotypes at 14 days post-injury (n = 6 mice per genotype and timepoint, * P ≤ 0.05, ** P ≤ 0.01 and *** P ≤ 0.001 by two-way ANOVA with Bonferroni post-hoc analysis). (B) Representative SCG10 immunostained images of sciatic nerves after single (3 days; upper panels) or injury-conditioned (7 + 3 days; lower panels) sciatic nerve crush injuries for Khsrp+/+ and Khsrp–/– are shown. Proximal is on the left and distal on the right; the dashed line indicates the injury site, with the second injury for the double crush injured animals placed at ∼0.5 cm proximal to the initial injury site [scale bar = 500 μm]. (C) Regeneration indices calculated as fraction of SCG10 axonal profiles relative to the injury site (0 μm) are shown as mean ± SEM as indicated. There was no significant difference in the regeneration after the single injury, but the injury-conditioned Khsrp–/– mice show significantly higher regeneration indices. Refer to Supplemental Figure S3B for regeneration index comparisons of naïve versus injury-conditioned nerves within genotypes (N = 5 mice per genotype and condition; * P ≤ 0.05, ** P ≤ 0.01 and *** P ≤ 0.001 by two-way ANOVA with Bonferroni post-hoc analysis). (D) Confocal XYZ images of gastrocnemius muscles of the injury-conditioned Khsrp+/+ and Khsrp–/– mice at 14 days after second nerve crush are shown. NMJs are detected by post-synaptic (α-bungarotoxin; green) and pre-synaptic markers (cocktail of anti-NF, -synapsin I and -synaptophysin; red) signals showing higher matching of pre- and post-synaptic markers in Khsrp–/– than Khsrp+/+ mice. Inset panels on lower right of both rows show higher magnification of the NMJs outlined by dashed boxes [scale bars = 20 μm for main panels and 5 μm for insets]. (E) Quantification of NMJ occupancy (% presynaptic area/postsynaptic area) shows significantly greater occupancy in the injury-conditioned Khsrp–/– than in Khsrp+/+ mice but no difference between genotypes was seen with the single crush lesion (injury-conditioned = 7 + 14 days; single nerve crush = 14 days). Data are expressed as mean ± SEM (N ≥ 15 NMJs quantified in three animals per condition per genotype; ** P ≤ 0.01 by Student's t test).

