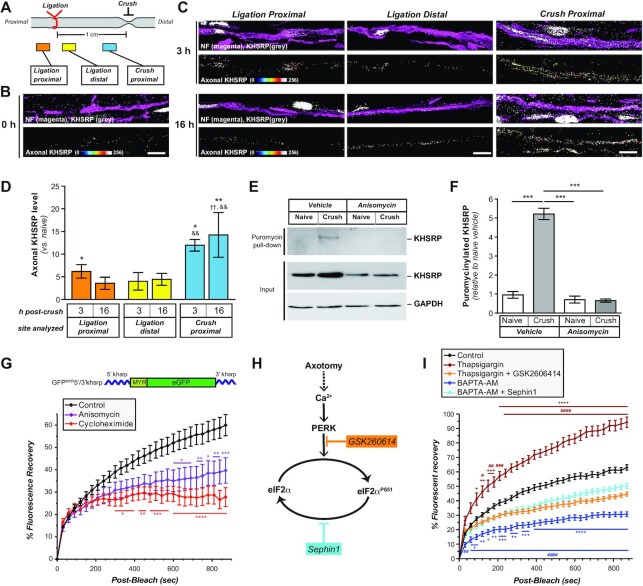
Figure 5.
Khsrp mRNA is rapidly translated in axons after injury. (A) Schematic of nerve ligation model used for panels B and C. Proximal nerve is on the left and distal on the right as indicated. The nerve was ligated and then immediately crushed ∼1 cm distal to the ligation.(B, C) Confocal images for KHSRP protein in naïve (B) and post-crush injury (3 and 16 h; (C). Upper rows of image pairs show XYZ projections of merged signals for KHSRP (grey) and NF (magenta), while lower rows show ‘axonal KHSRP’ signals as from individual Z planes that were projected as an XYZ image. As in Figure 1E, the strong signals that are outside of the axons are in Schwann cell nuclei based on DAPI co-labeling (data not shown). Representative images for ligation efficiency and KHSRP signals proximal and distal to ligation are shown in Supplemental Figure S4 [scale bar = 5 μm]. (D) Quantification of the axonal KHSRP immunoreactivity from ligation proximal and distal and crush sites are shown as mean ± SEM (N = 3 animals per time point; * P ≤ 0.05 and ** P ≤ 0.01 for indicated time points versus naïve nerve, ††P ≤ 0.01 for indicated time points versus ligation proximal, and && P ≤ 0.01 for indicated time points versus ligation distal by Student's t-test; ligation proximal versus distal have no significance). (E) Representative immunoblots for ex vivo puromycinylated naïve versus crushed sciatic nerve segments are shown as indicated. Protein synthesis inhibition with anisomycin completely blocks the puromycinylation of KHSRP in axoplasm samples extruded from the nerve segments, and GAPDH shows relatively equivalent protein loading across the lanes. Note that total KHSRP levels also increases with crush injury and this was attenuated by anisomycin. (F) Quantification of puromycinylated KHSRP signals from (D) is shown as mean ± SEM. Crush injury significantly increases axonal KHSRP synthesis and this blocked by anisomycin (N = 3; *** P ≤ 0.001 by one way ANOVA with Tukey's post-hoc analysis). (G) FRAP analyses for distal axons of neurons transfected with GFPMYR5’/3’khsrp (schematic above graph) is shown as normalized average % recovery ± SEM. Pre-treatment with anisomycin or cycloheximide significantly attenuates the GFP recovery, indicating protein synthesis dependent recovery for GFPMYR fluorescence in the axons (N ≥ 10 neurons over three culture preparations; * P ≤ 0.05, ** P ≤ 0.01 and *** P ≤ 0.005 by two-way ANOVA with Bonferroni post-hoc analyses for indicated time points versus control). Representative images sequences for FRAP are shown in Supplemental Figure S5. (I) Schematic for proposed signaling pathway for axotomy induced increase in axoplasmic Ca2+ leading to eIF2α phosphorylation is shown. GSK260614 was used as a specific PERK inhibitor and Sephin1 as an inhibitor of eIF2α dephosphorylation. (H) FRAP analyses for distal axons of neurons transfected with GFPMYR5’/3’khsrp reporter is as normalized average % recovery ± SEM. Treatment with thapsigargin increased and BAPTA-AM decreased recovery over control conditions. The thapsigargin-induced increase was blocked by GSK260614, while the BAPTA-AM-induced decrease was partially blocked by Sephin1 (N ≥ 17 neurons over three culture preparations; # P ≤ 0.05, ## P ≤ 0.01, ### P ≤ 0.005 and #### P ≤ 0.001 for thapsigargin or BAPTA-AM versus corresponding control time points and +P ≤ 0.05, ++P ≤ 0.01, +++P ≤ 0.005 and ++++P ≤ 0.001 for thapsigargin or BAPTA-AM versus corresponding thapsigargin + GSK260614 or BAPTA-AM + Sephin1 time points by two-way ANOVA with Bonferroni post-hoc analyses for indicated time points versus control; for data points appearing to error bars, the SEM is too small to show).

