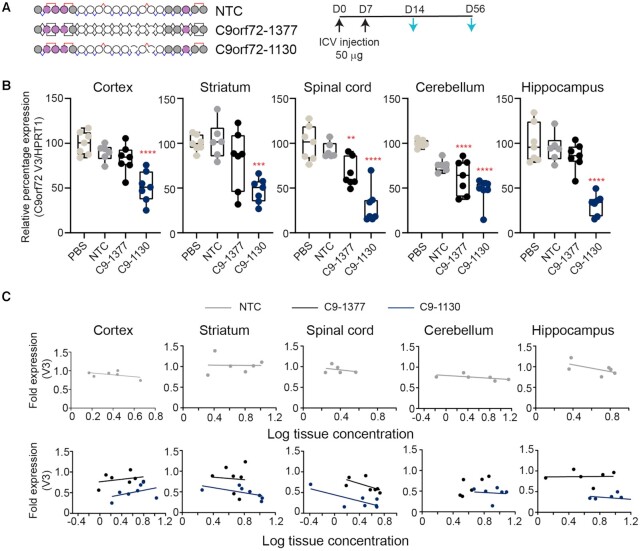
Figure 6.
Stereopure oligonucleotides exhibit enhanced silencing compared with stereorandom across the CNS. (A) Schematic representation of oligonucleotides used in this study and the dosing regimen (top). Black arrows indicate dosing; light blue arrows indicate evaluation. (B) Relative expression of C9orf73 V3 at 2 weeks is shown for each treatment group in cortex, striatum, spinal cord, cerebellum, and hippocampus. Data are presented as box and whisker plots with box from min to max with data from individual mice shown, n = 7, **P< 0.01, *** P< 0.001, ****P< 0.0001; P values calculated by one-way ANOVA. (C) Relationship between fold change in C9orf72 V3 expression and measured tissue exposure at 2 weeks is shown for NTC (top) and C9orf72 oligonucleotides C9-1377 and C9-1130 (bottom) in cortex, striatum, spinal cord, cerebellum, and hippocampus. Each point represents one mouse. Lines represent best-fit for simple linear regression analysis.

