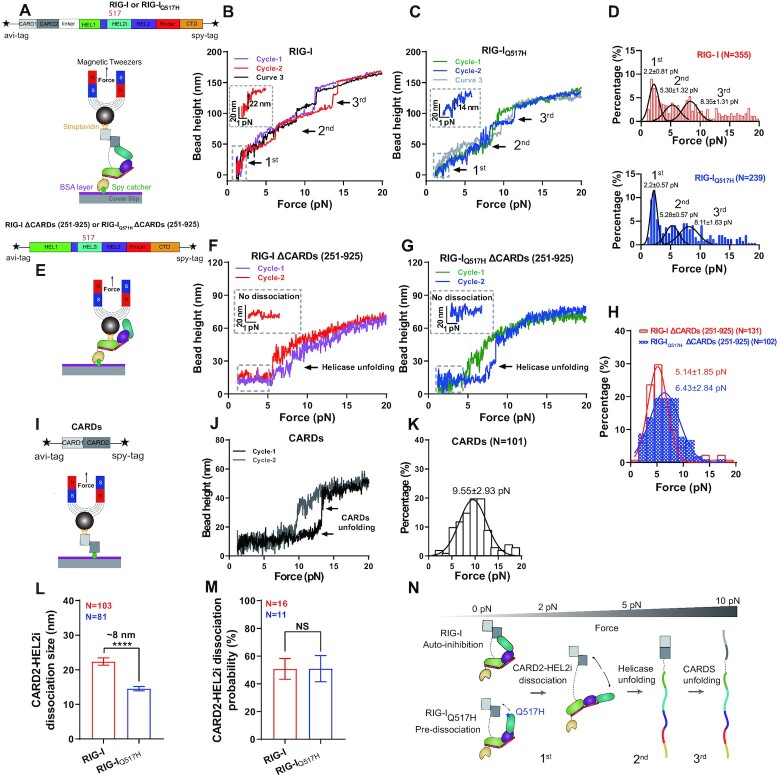
Figure 2.
Profiling the conformations of RIG-I and RIG-IQ517H by single-molecule magnetic tweezers (MT). (A) Schematic of RIG-I domains, tag engineering, and conformational profiling in MT. (B, C) Representative conformational curves of RIG-I (B) and RIG-IQ517H (C). Three main conformational changes are marked with arrows, wherein the first is magnified in a dashed box labeled with step size. (D) Force histogram for conformational changes of RIG-I (red) and RIG-IQ517H (blue). The three peaks obtained by Gaussian fitting are responses to the three main conformational changes in (B) and (C). (E) Schematic of the RIG-I helicase, tag engineering, and conformational profiling in MT. (F, G) Representative conformational curves of RIG-I ΔCARDs (F) and RIG-IQ517H ΔCARDs (G). Conformational changes are marked with arrows, wherein the 0–5 pN area is magnified in a dashed box. (H) Force histogram for conformational changes of RIG-I ΔCARDs (red) and RIG-IQ517H ΔCARDs (blue). The force peak obtained by Gaussian fitting is a response to the conformational change in (F) and (G). (I) Schematic of the RIG-I CARDs domain, tag engineering, and conformational profiling in MT. (J) Representative conformational curves of CARDs; conformational changes are marked with arrows. (K) Force histogram for conformational changes of CARDs. The force peak obtained by Gaussian fitting is a response to the conformational change in (J). (L) The size of CARD2-HEL2i dissociation of RIG-I and RIG-IQ517H. Data were derived from <3.75 pN, wherein the first conformational change occurred. (M) The dissociation probability of CARD2-HEL2i of RIG-I and RIG-IQ517H; results are represented from a single tether that was repeatedly stretched for at least 6 cycles. (N) Conformational changing profiles of RIG-I and RIG-IQ517H, wherein CARD2-HEL2i dissociation, helicase unfolding and CARDs unfolding occurred sequentially upon force. Data are presented as the mean ± SD in (D), (H) and (K) and as the mean ± SEM in (L) and (M); statistics indicate the significance of differences between compared sample states determined by Student's t test: ****P ≤ 0.0001; NS denotes nonsignificant in (L) and (M).

