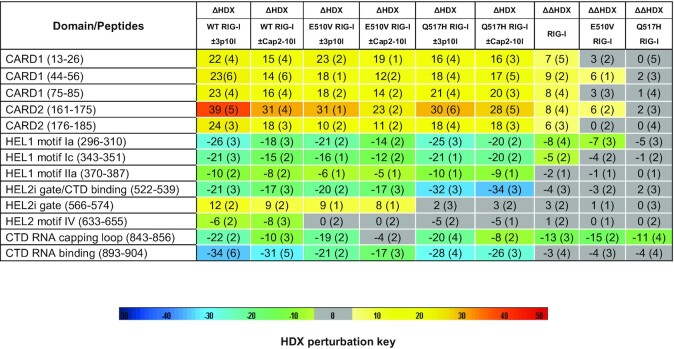
Table 2.
HDX data of RIG-I, RIG-IE510V, and RIG-IQ517H upon RNA proofreading of 3p10l and Cap2-10l. Differential ΔHDX and ΔΔHDX views of the indicated protein or protein complex upon binding to 3p10l or Cap2-10l. The values listed under each HDX experiment are the averaged differences in the percentage of deuterium incorporation of the corresponding peptide derived from two different states across all exchange time points (i.e. 0, 10, 60, 300 and 900 s). In the comparison of two samples, the perturbation %D is determined by calculating the difference between the samples. HDX Workbench colors each peptide according to the smooth color gradient HDX perturbation key (D%) shown in the figure. Differences in %D between -5% and 5% are considered nonsignificant and are colored gray according to the HDX perturbation key. A negative value represents decreased deuterium incorporation or stabilization, while a positive value represents increased deuterium incorporation or destabilization in the corresponding region of the receptor when a binding event takes place. Blank regions represent undetected peptides for the corresponding experiment

|
