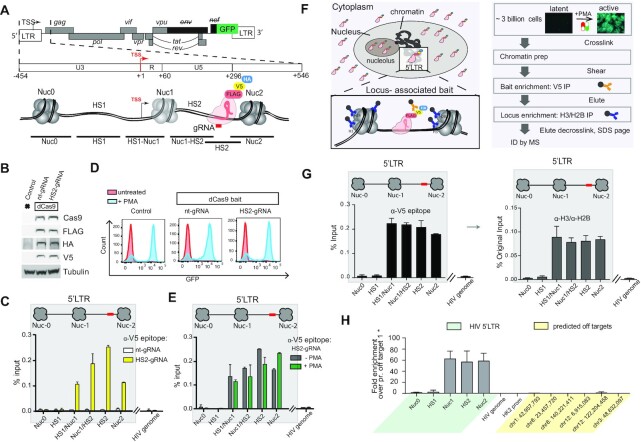
Figure 1.
dCas9 targeted chromatin and histone enrichment for mass spectrometry (Catchet-MS), a method to isolate and identify locus-bound protein complexes in vivo. (A) Schematic representation of the genomic organization of the integrated HIV-1 provirus in J-Lat 11.1 cells, encoding GFP and containing a frameshift mutation in env and a partial deletion of nef. The 5′ LTR region is further segmented into the U3, R, and U5 regions. Three strictly positioned nucleosomes, Nuc-0, Nuc-1 and Nuc-2, delimit the nucleosome-free regions HS1 and HS2, hypersensitive to nuclease digestion, as indicated. The HS2 region, to which the multiple epitope-tagged HA-V5-FLAG-dCas9 bait is guided, is indicated. The amplicons used to scan the chromatin region in ChIP-qPCR are shown. (B) Western blot analysis indicates expression of multiple epitope-tagged HA-V5-FLAG-dCas9 bait in modified J-Lat 11.1 cells using antibodies specific for Cas9, V5, FLAG and HA as indicated. Parental J-Lat 11.1 cell lysate is used as a negative control and α-Tubulin is used as a loading control. (C) ChIP-qPCR analysis with anti V5 epitope affinity beads indicate specific enrichment of the HA-V5-FLAG-dCas9 bait over the guided HIV-1 LTR region. White bars represent data generated in cells expressing the dCas9 bait together with a non-targeting gRNA (nt-gRNA), yellow bars represent data generated in cells expressing the bait and the single guide RNA targeting the HS2 region of the HIV-1 5′LTR (HS2-gRNA). Data show a representative experiment, error bars represent the standard deviation (±SD) of two separate real-time PCR measurements. HIV-1 5′LTR sequences recovery is calculated as a percentage of the input. (D) Flow cytometry histograms show the distribution of GFP positive cells in unstimulated and PMA stimulated control J-Lat 11.1 cells, cells expressing the dCas9 bait and a non-targeting gRNA (nt-gRNA) and cells expressing the bait and the HS2 targeting gRNA (HS2-gRNA). (E) ChIP-qPCR analysis with anti V5 epitope affinity beads in latent (-PMA; grey bars) and PMA treated cells (+PMA; green bars) expressing the dCas9 bait and the HS2-gRNA. Data are the mean of 2 independent experiments (±SD). HIV-1 5′LTR sequences recovery is calculated as a percentage of the input. (F) Schematic representation of the dCas9 bait cellular localization (left panel) and the Catchet-MS workflow (right panel). Approximately 3 billion cells per condition are cross-linked with formaldehyde to stabilize the protein-protein and protein DNA interaction. Following a stringent chromatin enrichment protocol, the cross-linked chromatin is isolated and fragmented by ultrasound sonication. The dCas9 containing complexes are immunoprecipitated using anti V5 antibody conjugated affinity beads, eluted from the beads, and used as input material for a second round of purification with anti-histones (H3, H2B) antibody-conjugated beads, in order to remove the non-chromatin bound fraction of the HA-V5-FLAG-dCas9 bait complexes and to enrich for the locus associated bait complexes. Immunoprecipitated material is finally decrosslinked, resolved on an SDS-page and prepared for mass spectrometry analysis. (G) (Left panel) ChIP-qPCR analysis with anti V5 epitope affinity beads in chromatin fraction prepared from unstimulated cells indicates specific enrichment of HA-V5-FLAG-dCas9 over the HIV-1 5′LTR. Data show a representative experiment, error bars represent the standard deviation (SD) of two separate real-time PCR measurements, HIV-1 5′LTR levels are calculated as percentages of the input. The V5 affinity-purified chromatin (represented in top panel) was eluted and used as input for a sequential immunoprecipitation with a mix of histone H2B and H3 conjugated affinity beads and the isolated material was analyzed by qPCR (Right panel). ChIP-qPCR with anti H3/H2B conjugated affinity beads indicates 5′LTR enrichment of HA-V5-FLAG-dCas9 bait after sequential V5/histone affinity purification.Data show a representative experiment, error bars represent the standard deviation (SD) of two separate real-time PCR measurements, HIV-1 5′LTR levels in both the V5 and histone affinity purification are calculated as percentages of the same original input. (H) Average coverage profiles using ChIP sequencing reads mapped 500 bp upstream and downstream of the peak center at the 5′LTR region of the HIV genome (‘Targets’) to the respective coverage around the predicted off targets (‘OffTargets’). ‘Start’ denotes the starting base pair of the aforementioned 1 kb region around the peak centers and ‘End’ the ending base pair respectively.

