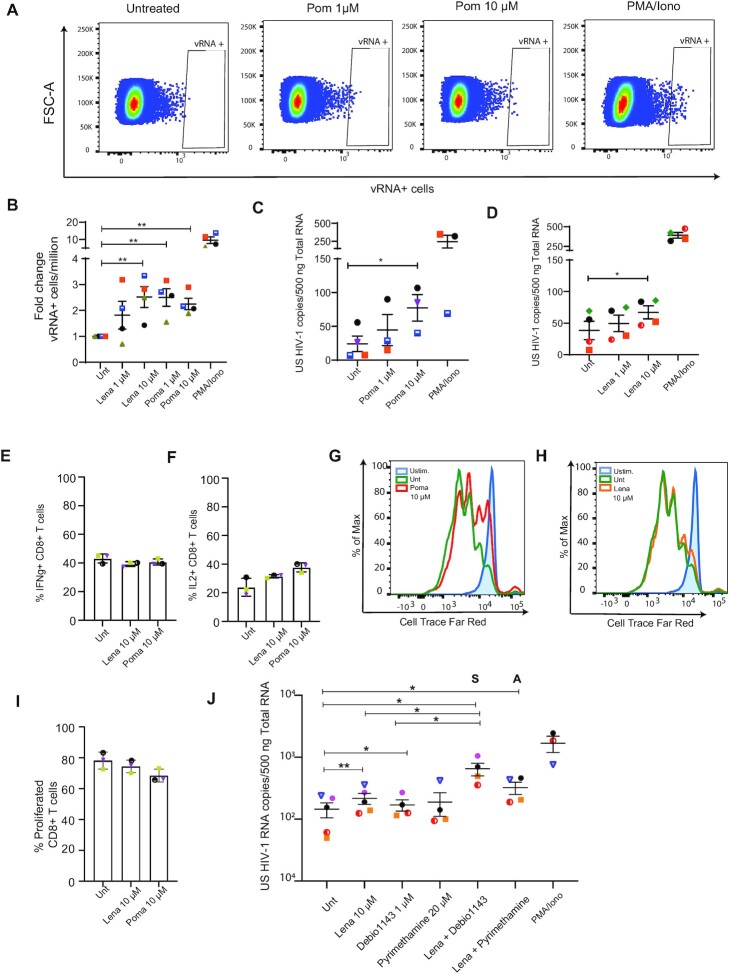
Figure 5.
FDA-approved thalidomide analogues pomalidomide and lenalidomide reactivate HIV-1 latency and synergizes with other LRAs in cells obtained from HIV-1 infected donors. (A) Representative FISH-Flow dot plots of CD4+ T cells from HIV-1 infected donors ex vivo treated with pomalidomide at 1 and 10 μM concentration for 24 h. (B) Graph panel showing the fold increase in vRNA+ cells/million in ex vivo treated CD4+ T cells from HIV-1 infected donors relative to Untreated control as measured by FISH-Flow (A). Cells were treated with pomalidomide or lenalidomide at the indicated concentrations for 24 hours and vRNA + production was analyzed by FISH-Flow. Error bars represent the mean and standard deviation of independent experiments. Statistical significance was calculated using paired Wilcoxon test: * P < 0.05, ** P < 0.01. (C, D) Changes in cell-associated unspliced HIV-1 RNA in CD4+ T cells isolated from HIV-1 infected donors after treatment with pomalidomide (C) and lenalidomide (D). CD4+ T cells were isolated from PBMCs from HIV-1 infected donors and treated as indicated for 24 h. Error bars represent the mean and the standard deviation. Statistical significance was calculated using paired two-tailed t test: * P < 0,05. (E, F) Percentage of INFg (E) and IL2 (F) producing CD8+ T cells from three healthy donors upon treatment with lenalidomide and pomalidomide as indicated. Cells were treated as indicated for 18 h followed by PMA/Ionomycin (50 ng/1 μM) stimulation for 7 h in the presence of a protein transport inhibitor or remained unstimulated. IFN-g and IL2 production was assessed by intracellular staining and analyzed by flow cytometry. Numbers in the plot show percentage of IFNg and IL2 producing cells. (G, H) Representative histogram of proliferative capacity of unstimulated or aCD3/CD28 stimulated CD8+ T cells in the presence or absence of pomalidomide (G) or lenalidomide (H). Cells were stained with a proliferation dye and analyzed 72 h later by flow cytometry. Dividing cells show decreased intensity of proliferation dye as it becomes diluted upon cell division. (I) Percentage of proliferated CD4+ T cells from three healthy donors in the presence of pomalidomide and lenalidomide as described in (G, H). (J) Synergistic reactivation of HIV-1 latency by lenalidomide in combination with Debio 1143 and Pyrimethamine in CD4+ T cells obtained from HIV-1 infected donors as measured by cell associated unspliced HIV-1 RNA. CD4+ T cells were isolated from PBMCs from HIV-1 infected donors and treated as indicated for 18–24 h. Error bars represent the mean and the standard deviation. Statistical significance was calculated using paired two-tailed t test: * P < 0,05, ** P < 0,01. S represents synergism, A represents additive effects calculated by using the coefficient of drug interaction (CDI) method.

