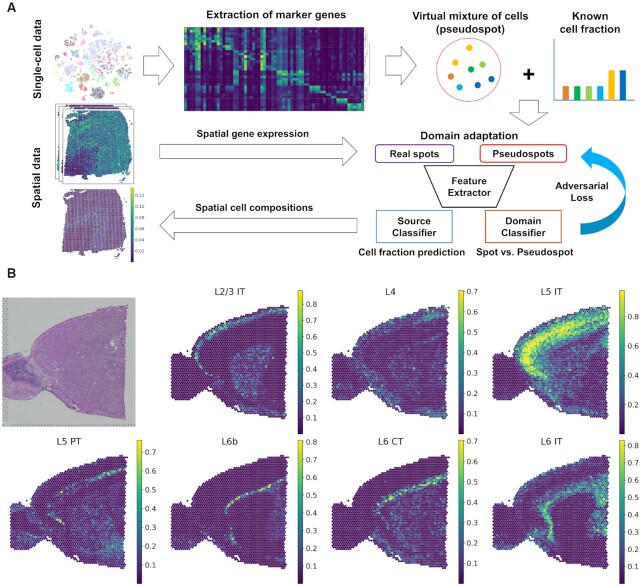
Figure 1.
CellDART analysis in human and mouse brain tissues. (A) Schematic diagram for CellDART analysis. The human dorsolateral prefrontal cortex (DLPFC) dataset was preprocessed, and the marker genes for each cell cluster were extracted. The shared genes between the pooled cluster markers and the spatial transcriptomic data were selected for the downstream analysis. Then, 20 000 pseudospots were generated by randomly selecting eight cells from the single-cell data and giving them random weights. A feature extractor with a source and domain classifier was trained to estimate the cell fraction from the pseudospot and distinguish the pseudospots from the real spatial spots. First, the weights of the neural network were updated except for the domain classifier. Next, the data label for the spot and pseudospot was inverted, and only the domain classifier was updated. Finally, the trained CellDART model was applied to spatial transcriptomics data to estimate the cell proportion in each spot. (B) Spatial mapping of seven layer-specific mouse excitatory neurons predicted by CellDART. The figure in the top left corner shows the mouse brain tissue slide. Colormaps present the maximum and minimum values for the corresponding cell fraction.

