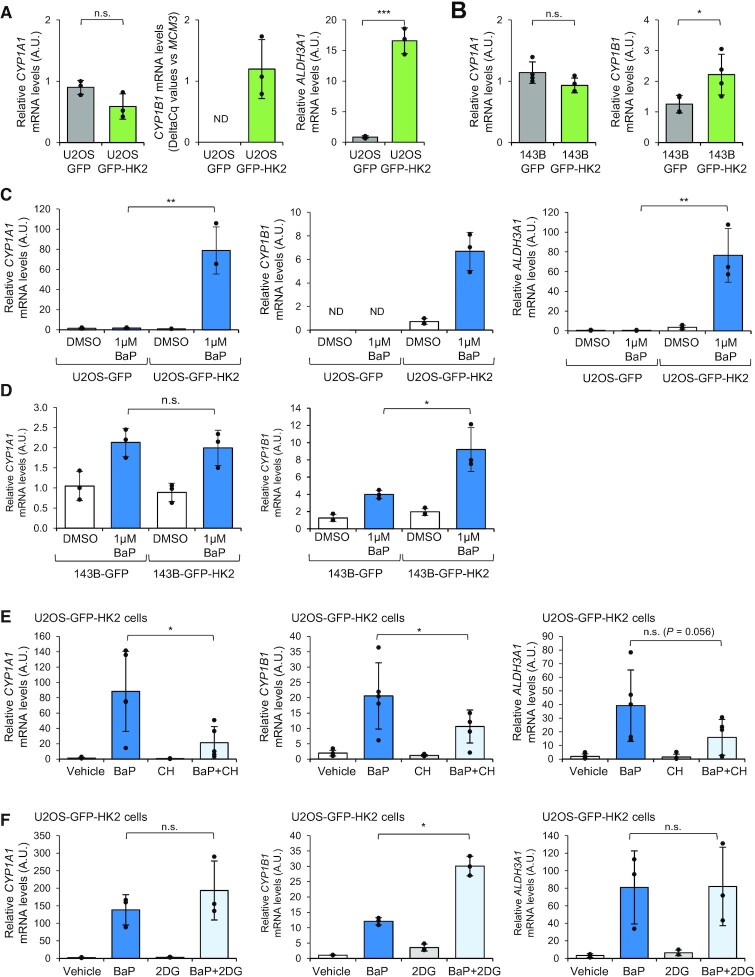
Figure 4.
Over-expression of HK2 enhances a subset of AHR transcriptional target genes expression and potentiates the AHR transcriptional response to BaP exposure. (A) RT-qPCR analysis of CYP1A1 (left graph), CYP1B1 (middle graph) and ALDH3A1 (right graph) expression in U2OS cells expressing GFP or GFP-HK2 (n = 3). A.U., arbitrary unit. ND, not detected by RT-qPCR. (B) RT-qPCR analysis of CYP1A1 (left graph) and CYP1B1 (right graph) expression in 143B-GFP and 143B-GFP-HK2 cells (n = 4). A.U., arbitrary unit. Of note, ALDH3A1 is not detected in these cell lines. (C) RT-qPCR analysis of CYP1A1 (left graph), CYP1B1 (middle graph) and ALDH3A1 (right graph) expression in U2OS cells expressing GFP and GFP-HK2 and treated with BaP 1 μM or vehicle (i.e. DMSO) for 48 h (n = 3). ND, not detected by RT-qPCR. (D) RT-qPCR analysis of CYP1A1 (left graph), CYP1B1 (right graph) expression in 143B cells expressing GFP and GFP-HK2 and treated with BaP 1 μM or vehicle (i.e. DMSO) for 48 h (n = 3). (E) RT-qPCR analysis of CYP1A1 (left graph), CYP1B1 (middle graph) and ALDH3A1 (right graph) expression in U2OS-GFP-HK2 cells treated with vehicle (i.e. DMSO), BaP (1 μM), AHR antagonist CH-223191 (10 μM) or BaP + CH-223191 for 48 h (n = 5). A.U., arbitrary unit. (F) RT-qPCR analysis of CYP1A1 (left graph), CYP1B1 (middle graph) and ALDH3A1 (right graph) mRNA levels in U2OS-GFP-HK2 cells treated with vehicle (i.e. DMSO), BaP (1 μM), hexokinase inhibitor 2-DG (2mM) or BaP + 2-DG for 48 h (n = 3). A.U., arbitrary unit. P-value was calculated using unpaired Student's t-test for panels A, B, C, D, and paired Student's t-test for panels E and F. n.s., not significant; *P < 0.05; **P < 0.01; ***P < 0.001.

